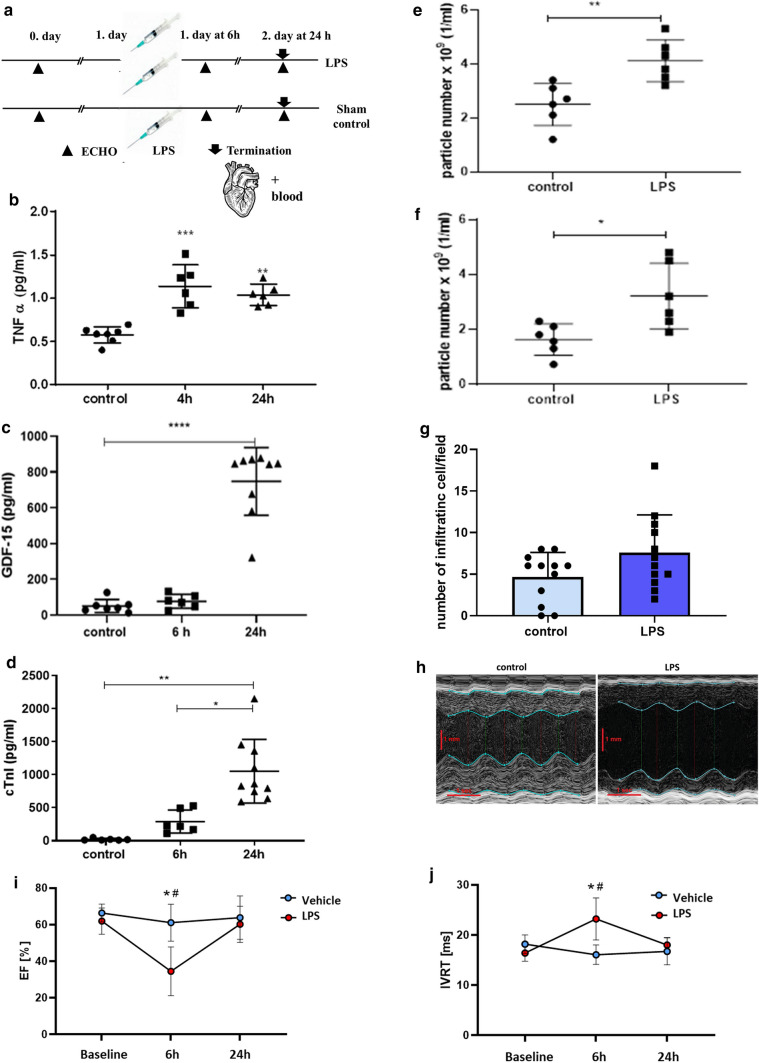
Fig. 2.
Effect of an LPS injection on inflammation, EV release, and cardiac function. a C57/Bl6 mice were injected intraperitoneally with 6 mg/kg of LPS/mouse. b TNF-α in platelet-free plasma (PFP) (n = 6–8). c GDF-15 in PFP (n = 6–8). ELISA results after 4 h/6 h and 24 h after LPS injection. d Cardiac Troponin I was measured by ELISA 6 h and 24 h after LPS injection. Data points represent values from individual mice (means ± SD are indicated). *P < 0.05; **P < 0.01; ***P < 0.005; ****P < 0.001). e, f mEVs were isolated from 200 µl of mouse PFP using differential centrifugation e) followed by ultracentrifugation to separate sEVs f n = 6. Particle concentration was measured by NTA 6 h and 24 h after the treatment. g The graph shows the number of infiltrating cells/fields for each condition. Quantitative results indicate the average values ± SD of n = 3 animals in each group. The results were analyzed by Student’s T-test, no significant difference was found. h Representative images of the echocardiography analysis of the mouse hearts 6 h after LPS injection. i, j LPS led to a significant reduction of EF (ejection fraction) and prolongation of IVRT (isovolumic relaxation time). Data were analyzed using two-way ANOVA followed by Tukey's multiple comparisons test. Data are presented as mean ± SD (*P < 0.05 vs vehicle 6 h, #P < 0.05 vs LPS baseline)

