Fig. 3.
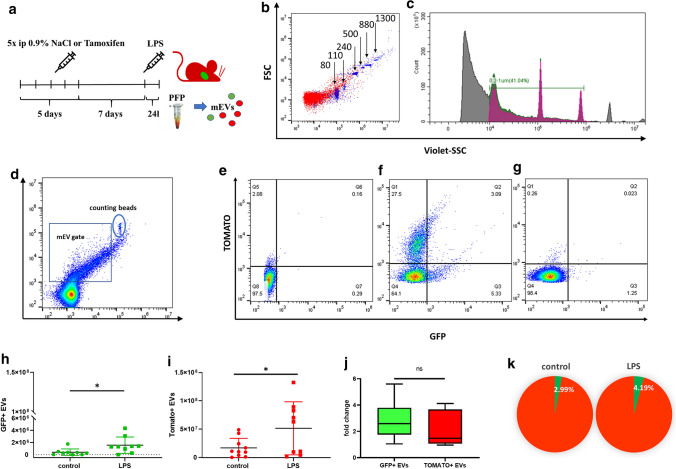
Effect of LPS administration on GFP + EV release to the circulation. a Schematic protocol of Tamoxifen induction and LPS injection of mice. b, c Flow cytometry analysis. Calibration beads were used (0.2–1 µm). d The gating strategy for mEVs and the 1 μm counting beads. e As a negative control, PFP-derived mEVs were analyzed from C57Bl6 mice. f Cardiomyocyte-derived EVs as GFP+ events. mEVs secreted by all other cells were Tomato+. g A 95 ± 1% reduction of the event number after exposure to 0.1% Triton. h, i Events within the mEV gate were then analyzed, and GFP + events with/without LPS injection are shown on (h). i demonstrates Tomato+ events with/without LPS injection. The figure shows the results of three independent experiments (n = 9). The figure represents data from individual mEV samples (mice) as well the means ± SD (*P < 0.05, T-test). j Fold increase upon LPS treatment, n = 6 ns = nonsignificant (T-test). k The pie diagram represents the percentages of green fluorescent mEVs in control and LPS treated animals (n = 9 in each group)

