Fig. 1.

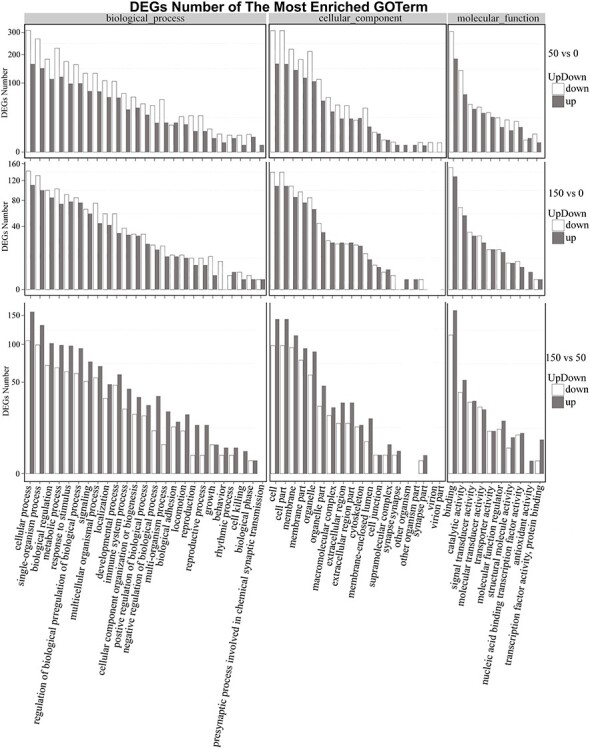
Gene ontology (GO) plot of genes with different expression patterns, including comparisons of the 50 vs 0 mGy, 150 vs 0 mGy and 150 vs 50 mGy groups.

Gene ontology (GO) plot of genes with different expression patterns, including comparisons of the 50 vs 0 mGy, 150 vs 0 mGy and 150 vs 50 mGy groups.