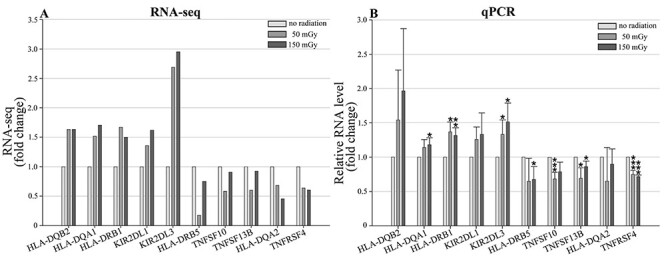
Fig. 5.

The expression profiles of 10 genes in human peripheral blood by the quantitative RT-PCR. (A) The expression patterns of DEGs under irradiation and no radiation treatment by RNA-seq; (B) the expression patterns of DEGs following irradiation (50 mGy and 150 mGy) and no radiation by qPCR; Data are presented as means ± SD of three independent experiments. The asterisks indicate significant differences compared with the control treatment, *P < 0.05; **P < 0.01; ***P < 0.005, t-test.
