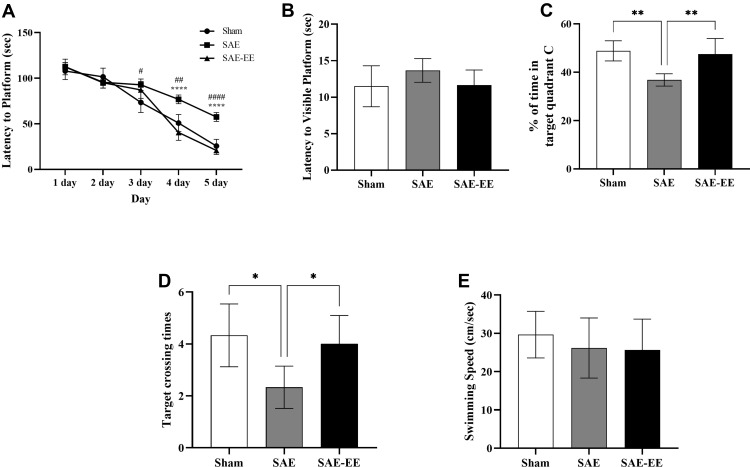
Figure 2.
(A) From day 3 on, the rats with SAE had a longer latency time to the platform than the sham rats. From day 4 on, the SAE-EE rats reached the submerged platform quicker than the SAE rats. For A, Sham vs SAE: #p < 0.05, ##P < 0.01, ####P < 0.0001; SAE vs SAE-EE: ****p < 0.0001. (B) No differences were found in latency to the visible platform. (C) The SAE rats spent less time in target quadrant C compared with sham or SAE-EE rats. For C, **p < 0.01. (D) The SAE rats had fewer target crossing times when compared with the sham or SAE-EE rats. For D, *p < 0.05. (E) No differences were observed for swimming speed among the groups. The assignment of order was counterbalanced across the rats in this test. Data represent the means ± standard error of the mean.
Abbreviations: SAE, sepsis-associated encephalopathy; EE, environmental enrichment.

