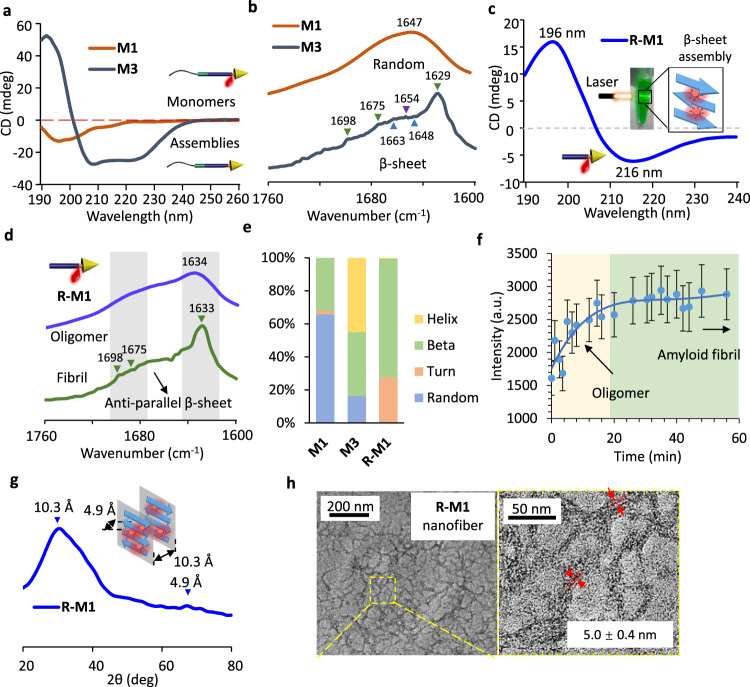
Fig. 3. Assembled structure conformations and self-assembly behavior in aqueous solution.
a CD spectra of M1 and M3 in DI water under a concentration of 200 μM. b The FTIR spectra of M1 and M3, powder samples collected from freeze dried sample solutions. c The typical β-sheet CD spectra of R-M1 in DI water (insert figure: the Tyndall phenomenon) under a concentration of 100 μM. d The FTIR spectra of dynamic growth of R-M1, powder samples collected from freeze dried sample solutions in different period. e Analysis of secondary structure composition of M1, M3, and R-M1 based on CD spectra. f, Elongation-nucleation growth procedure with ThT staining. The mean of data of three samples with the same conditions is shown and data are presented as mean values ± SD (n = 3) g, The WAXS spectrum and illustration of the R-M1 fibrils, powder sample collected from freeze dried sample solution. h, The TEM images of nanofibers morphology of R-M1.

