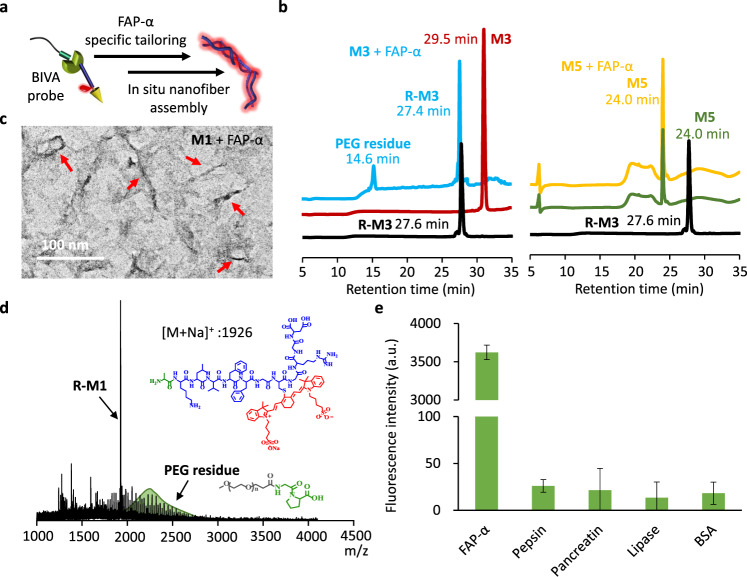
Fig. 4. The FAP-α specific molecule tailoring and inducing in situ assembly.
a The illustration the working mechanism of BIVA probe based on FAP-α catalytic hydrolysis. b HPLC curves of M3 and M5 after incubation with FAP-α in buffer. R-M3, M3 and M5 were synthesized controls. The TEM image (c), and the MALDI-TOF (d), results of M1 after tailoring by FAP-α in buffer, the red arrows represent the assembled fibrils of M1 after incubation with FAP-α. e The enzyme specificity of M1 in buffer. Buffer: 50 mM Tris, 1 M NaCl, 1 mg/mL, BSA, pH 7.5; Concentration of M1 and M3: 100 μM; Concentration of FAP-α: 50 μM; incubation time: 12 h. The mean of data of four samples with the same conditions is shown and data are presented as mean values ± SD (n = 4). p = 2.04E-22 < 0.001, p values were performed with one-way ANOVA by post hoc Tukey’s test for the indicated comparison.

