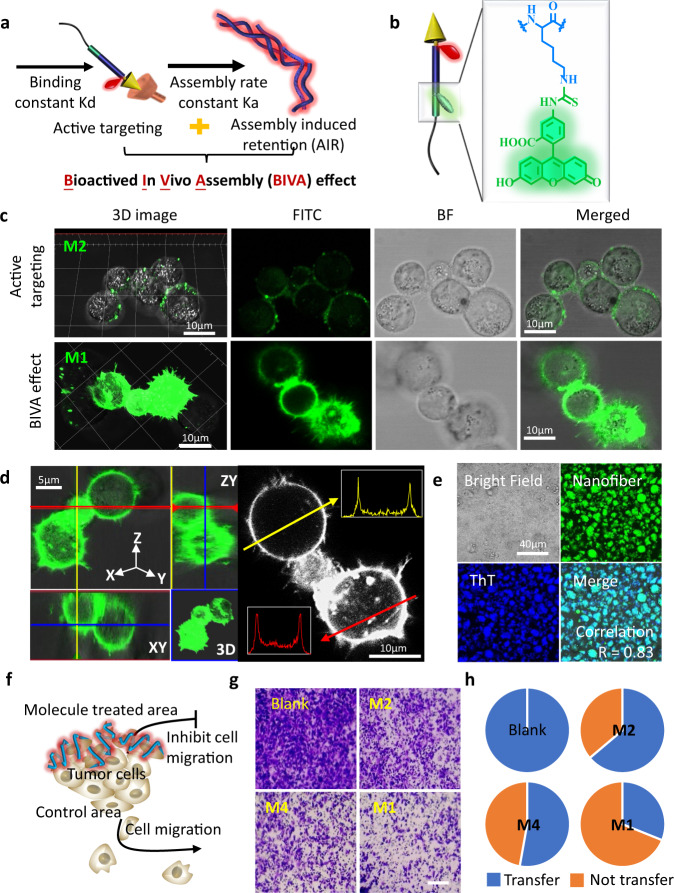
Fig. 5. The BIVA effect with enhanced targeting to pancreatic tumor cell for boundaries imaging.
a Illustration of BIVA effect: active targeting and assembly/aggregate induced retention (AIR) effect. b Chemical structure of FITC labeling. c 2D and 3D confocal images of M2 with active targeting property and M1 with BIVA effect on MIA PaCa-2 cells after incubation for 1 h. d The distribution of M1 on MIA PaCa-2 cell. e ThT staining of the lysed cell membrane of MIA PaCa-2. f, Illustration of migration inhibition after treated by BIVA probe. g The image of the migrated cells after treatment of PBS (blank), M2, M4, and M1. Scale bar: 100 μm. h The pie diagram of quantitative statistical calculation of the migrated cells (blue) in different groups. The blank control was set as 100% migrated cells.

