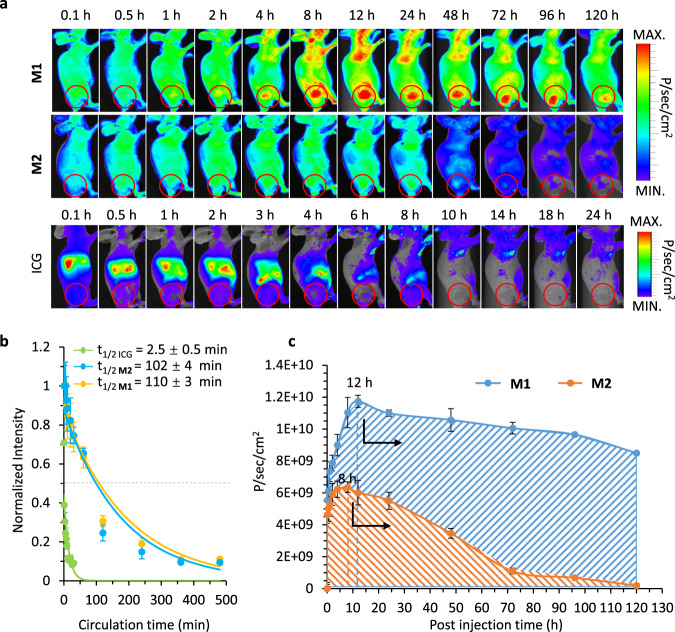
Fig. 6. The BIVA effect optimized the metabolism of the probe in vivo.
a The time-dependent NIR fluorescence image of mice bearing MIA PaCa-2 cells after intravenous administration of ICG, M2 and M1 with a dose of 16 mg/kg. The images acquired at time intervals from 0.1 h to 120 h are managed with the same procedure (The circles represent the locations of the tumors). b The blood circulation curve of ICG, M2 and M1 based on exponential curve fitting. The t1/2 value was the blood circulation half-life. c The time-dependent quantitative calculation of the average fluorescence intensity in tumor area and the area under the curve (AUC) of ICG, M2 and M1. The mean of three biological replicates is shown and data are presented as mean values ± SD (n = 3).

