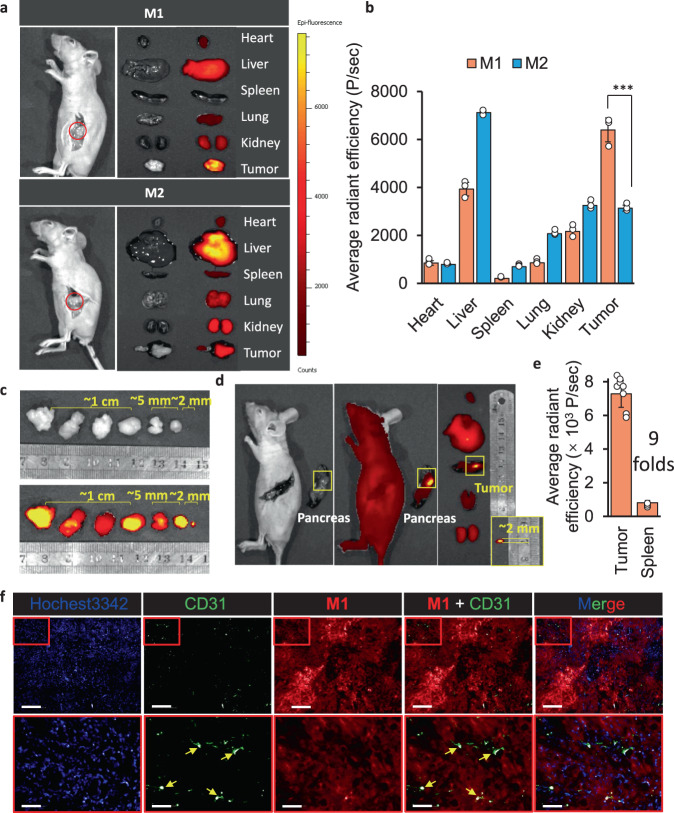
Fig. 7. The BIVA probe enhance orthotopic pancreatic tumor imaging in vivo.
a The in vivo NIR images of small orthotopic pancreatic tumor by M1 and M2, and the ex vivo of organ biodistribution including heart, liver, spleen, lung, kidney, and tumor. The mean of three biological replicates is shown (n = 3). b The quantitative analysis of average fluorescence intensity per organ area p = 0.000844 < 0.001, (n = 3). c The in vivo NIR images of orthotopic pancreatic tumor with individual difference with the same i.v. dose administration for 12 h. The mean of five biological replicates is shown (n = 5). d The small size (~2 mm diameter) orthotopic pancreatic tumor images and its ex vivo signal distribution. e The quantitative calculation of the signal in tumor area and healthy spleen area. The mean of eight biological replicates is shown. (n = 10) f The tumor histochemical staining with Hochest3342 (blue), CD31 (green) and M1 (red) post i.v. injection of M1 for 48 h. The yellow arrows pointed at the blood vessels. Bars of the up layer: 200 μm; Bars of the bottom layer: 50 μm. Data: mean ± standard deviation. Injection dose (i.v. administration): 16 mg/kg. Statistical analysis: one-way t test followed by post hoc Tukey’s test, ***p < 0.001.

