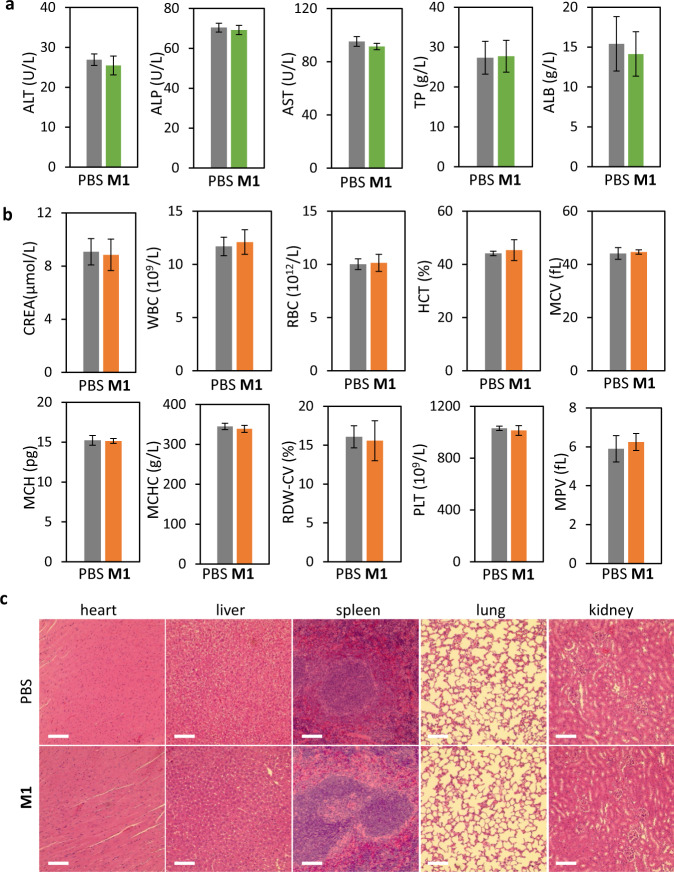
Fig. 8. Acute toxicity evaluation.
a Liver function indicators: alanine aminotransferase (ALT), alkaline phosphatase (ALP), aspartate aminotransferase (AST), total protein (TP) and albumin concentration (ALB). The mean of four biological replicates is shown and data are presented as mean values ± SD (n = 4). b Blood biochemical indicators: creatinine (CREA), white blood cells (WBC), red blood cells (RBC), hematocrit (HCT), mean corpuscular volume (WCV), mean corpuscular haemoglobin concentration (MCH), mean corpuscular hemoglobin concentration (MCHC), red cell volume distribution width-coefficient of variation (RDW-CV), platelet (PLT)and mean platelet volume (MPV). The mean of four biological replicates is shown and data are presented as mean values ± SD (n = 4). c Histologic sections of different organs: heart, liver, spleen, lung, kidney and pancreas compared with healthy group (PBS). Staining: H&E; Injection dose of M1. (i.v. administration): 16 mg/kg; Administration time: 24 h. Scale bar 200 μm.

