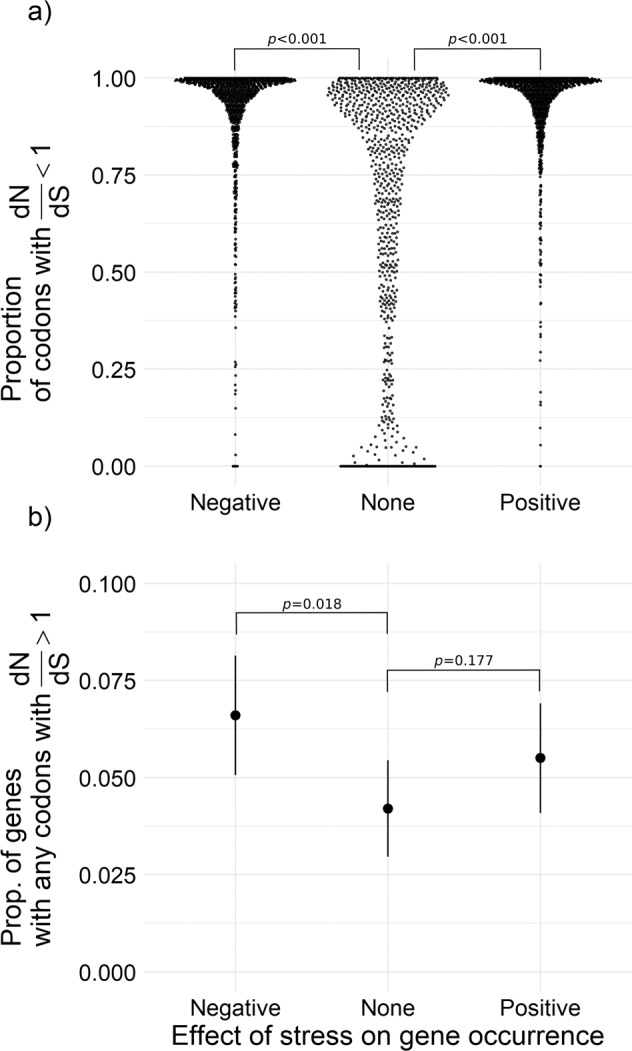
Fig. 5. Influence of environmental stress on dN/dS in stratified subsample of accessory genes in pangenome.

A Each point shows proportion of codons with dN/dS values < 1 (purifying selection) within a single accessory gene. Genes are categorised based on their stress response (z-score, based on occurrence along the stress gradient; n = 3000 genes, 1000 per category). Genes with small or no responses to stress (z-score ~ 0) overall have a lower proportion of codons under purifying selection (p < 0.001; Table S5). B Points show the mean and 95% prediction interval for the proportion of genes with any codons with dN/dS values > 1 (positive selection), plotted by each occurrence response category, based on a binomial model. Accessory genes with negative stress response have significantly higher proportion of genes under positive selection (p = 0.018; Table S5).
