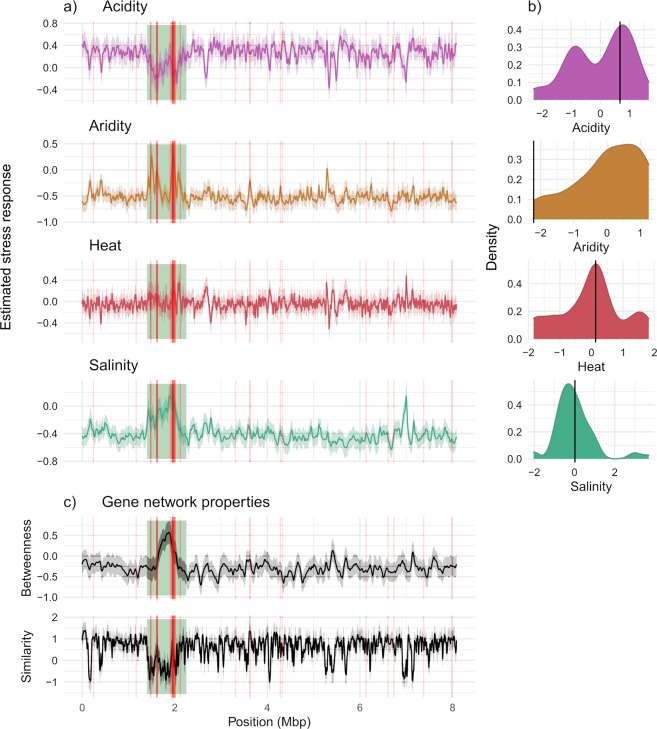
Fig. 7. Chromosomal mapping of gene loss/gain patterns and functional network trait values on complete genome sequence.
6274 out of 74,089 accessory genes in the pangenome could be matched and mapped to genome 36_1 (strain 36_1 from the same 374-strain population set, Genbank accession CP067102.1; Method I). A and C Together show that prominent changes in stress response and network trait properties concentrate in a large ~850 kbp region (green box), which also has a higher density of mapped core genes (red lines) along the chromosome. Solid lines (other than vertical red) are model prediction values that account for spatial non-independence in genomic position, while faded surrounding colours indicates 95% credibility. A Mapping of gene loss and gain patterns, based on gene occurrence stress responses (i.e. gene z-scores) with 95% credibility. B Smoothed data distribution of each environmental stress factor. Solid vertical line indicates stress values of soil sample where reference genome 36_1 originated. C Chromosomal mapping of gene network properties, similarity and betweenness. Notes on interpreting A: regions of gene-retention are indicated by values that change towards 0, regardless of whether the predominant z-score value is highly positive or negative. The predominant z-score is influenced by the sample of matching orthologue genes and the environmental origin of the reference genome. For example, in A acidity, the predominant z-score is strongly positive as a statistical expectation because the strain originates from more acidic environments. Whereas for aridity, the predominant z-score is negative because the strain originates from a relatively wetter environment.

