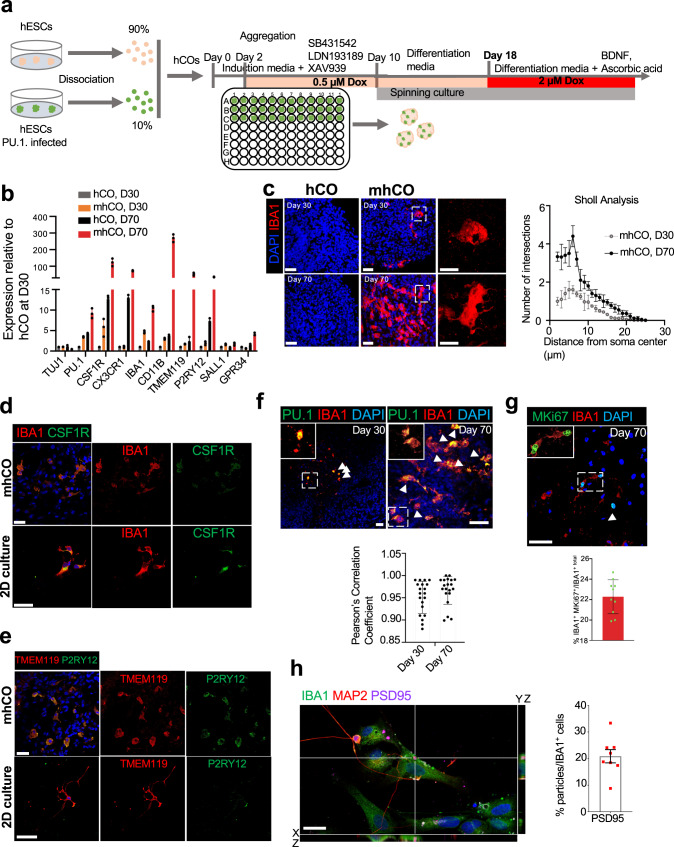
Fig. 1. Characterization of microglia-like cells in mhCOs.
a Schematic for generating mhCOs. 10% of PU.1-infected hESCs were mixed with 90% parental HES3 hESCs, and PU.1 priming and full induction were performed on day 2 and 18, respectively. b Expression of microglia-related genes from control hCOs and mhCOs (30-day and 70-day old). Gene expression was measured relative to control organoids on day 30 and normalized to β-Actin. Data represent the mean ± SEM (n = 5, three independent batches). c Left, immunostaining for IBA1 reveals the production of microglia-like cells in sectioned-mhCOs at days 30 and 70. IBA1+ cells were not found in control hCOs. Right, Sholl analysis of IBA1 + microglia-like cells from mhCOs at different time points. Data represent the mean ± SEM (n = 5 organoids from three independent differentiation replicates of two hESCs lines). d and e Immunostaining of mhCOs at day 70 and isolated microglia co-cultured with neurons (2D) for IBA1 and CSF1R (d) TMEM119 and P2RY12 (e). Representative images were shown (n = 5, from two independent batches). f Top, co-expression of PU.1 and IBA1 in hCOs and mhCOs at day 30 and 70. Bottom, quantification of Pu.1-derived IBA1 microglia-like cells. Data represent the mean ± SEM (n = 5 organoids from three independent differentiation replicates of two hESCs lines). Bottom, Pearson’s correlation coefficient of IBA1 with PU.1 in mhCOs at days 30 and 70. g Top, co-immunostaining for Ki67 and IBA1 in mhCOs at day 70. Bottom, quantification of proliferating IBA1 microglia-like cells. Data represent the mean ± SEM (n = 5 organoids from three independent differentiation replicates of two hESC lines). h Left, high-resolution imaging showed microglia isolated from mhCOs at day 90 and co-cultured D90 cortical neurons for 3 days contained inclusions of PSD95. Right, quantification of PSD95 particles in IBA1+ microglia-like cells. Data represent the mean ± SEM (n = 8, from three independent differentiation replicates of hESCs lines). The scale bar represents 50 μm in c–g and 20 μm in h.

