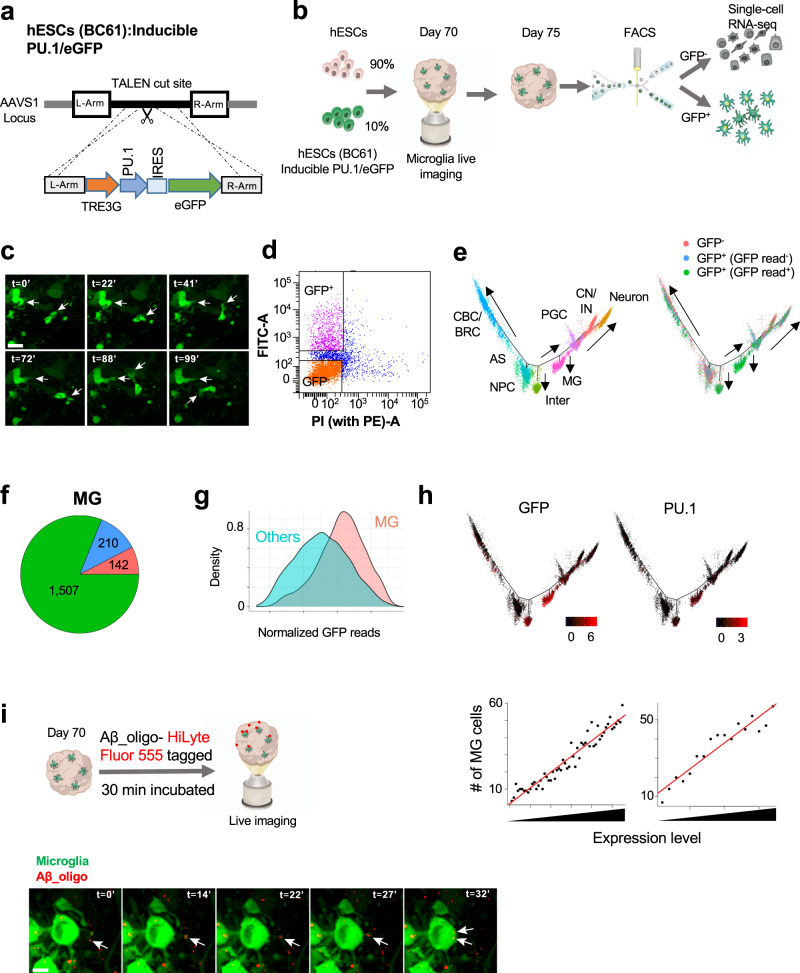
Fig. 3. Microglia lineage commitment of GFP-expressing cells and their roles in the organoid (mhCO).
a A construct to target the AAVS1 locus to generate rtTA-PU.1-IRES-eGFP+ hESC line (BC61). b Schematic showing the protocol for generating mhCOs by using hESCs (BC61). c Time-lapse imaging indicating GFP+ microglia over 100 min within mhCOs. Representative images with white arrowheads showing motile microglia. Time is shown in minutes. d FACS analysis of dissociated mhCOs at day 75 shows that GFP+ and GFP− cells are sorted for performing scRNA-seq. e Cell trajectory analysis of the single-cell transcriptome of GFP+ and GFP− cells. Cells are colored by trajectory branches and library sources. f Ratio of GFP+ and GFP− cells in MG clusters. g Comparison of GFP expression between MG and other branches (two-sided T-test p < 2.2e-16). h Relationship between GFP/PU.1 expression and MG lineage commitment. (Top) GFP and PU.1 expression are plotted in the cell trajectory map. (Bottom) Correlation between GFP/PU.1 expression and efficiency of MG lineage commitment. Cells are sorted by GFP/PU.1 expression and divided into 100-cells bins. The number of cells in the MG branch is shown in each bin. i Top, schematic showing Aβ42-oligo-(HiLyte)-555 treatment on mhCOs. Bottom, a representative image is showing GFP+ microglia phagocytosing Aβ (red) in around 32 min within mhCOs. The scale bar represents 20 μm in (c) and 10 μm in (i). Imaging was repeated in organoids from three independent differentiation experiments with similar results in c and i.

