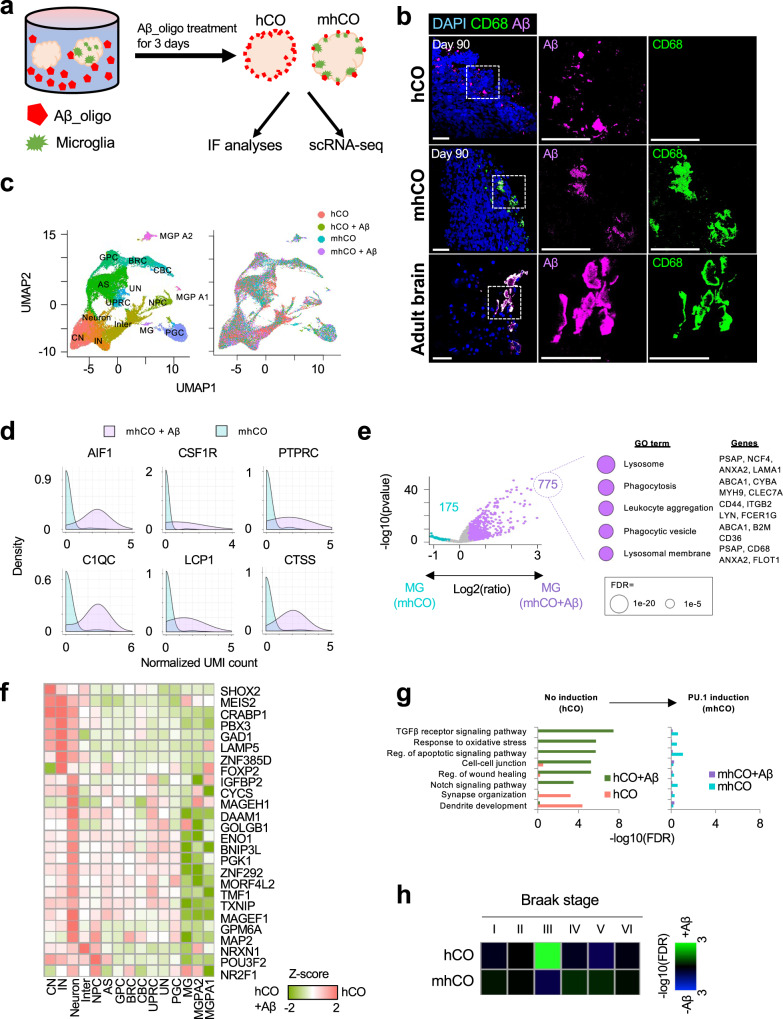
Fig. 4. Effects of Aβ treatment on cortical organoids.
a Experimental design to test the effect of Aβ_oligo treatment on control hCOs and mhCOs. b Co-Immunostaining for CD68 and Aβ in Aβ-treated control hCOs, mhCOs, and the adult human brain. Data are representative images of five organoids from three independent experiments. The scale bar represents 50 μm. c UMAP plot of single cells from non- and Aβ-treated hCOs and mhCOs colored by cell type assignment (left) and organoid type (right). Data depicts results from 49,867 cells. d Histogram representing significant gene induction related to microglia activation in non- and Aβ-treated mhCOs. p = 2.51e−11 (AIF1), 3.64e−4 (CSF1R), 2.79e−7 (PTPRC), 2.04e−10 (C1QC), 9.52e−7 (LCP1), and 1.42e−11 (CTSS) with two-sided t-test. e Volcano plot representing differential gene expression in microglia between non- and Aβ-treated mhCOs (left). 775 up- and 175 down-regulated genes are shown by purple and turquoise color, respectively. The other 31,788 genes are shown by gray color. The top five significant GO terms of upregulated genes in Aβ-treated microglia were shown by circle size (right). A two-sided t-test was used for comparison. f Heatmap representing the down-regulation of neuronal developmental genes in hCOs with Aβ treatment. Relative expression value in non-treated hCO to Aβ-treated hCOs was normalized as Z-score. g GO enrichment of global differentially expressed genes between non- and Aβ-treated organoids. Left and right bar plots were obtained from hCO and mhCO, respectively. h GSEA of Braak stage-specific gene signatures in Aβ-treated hCOs and mhCOs. The enrichment and depletion were visualized by blue and green colors, subsequently.

