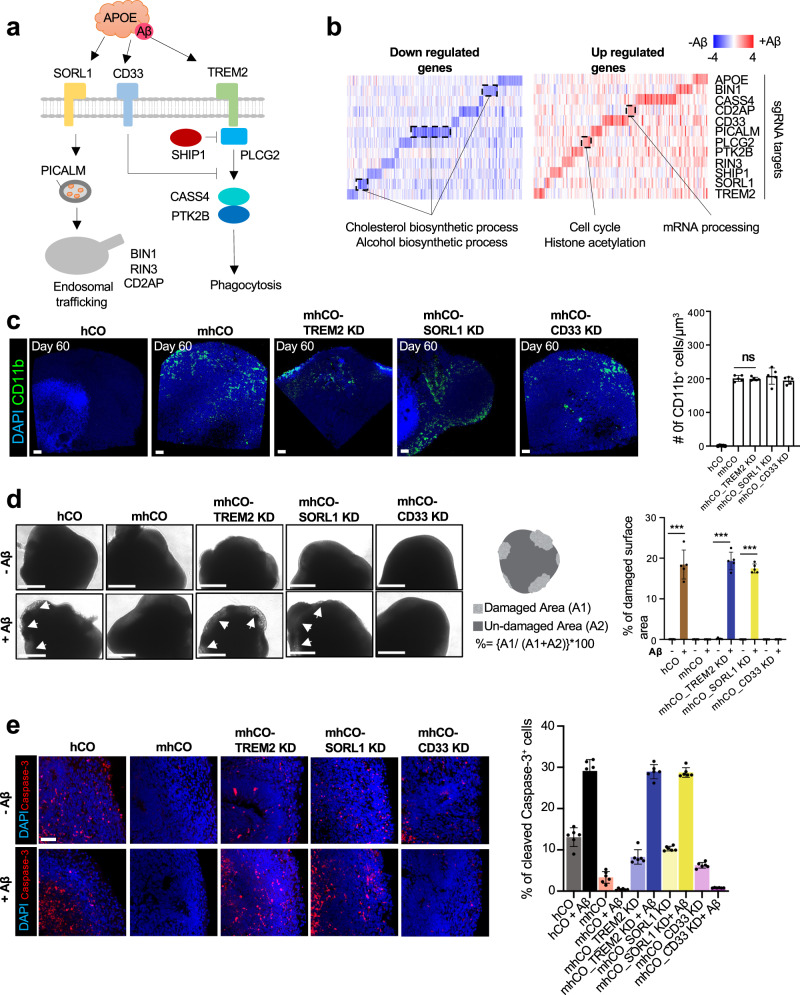
Fig. 5. CRISPRi-mediated suppression of AD-genes in MG from mhCOs.
a Relationship between target genes and pathways for endocytosis, phagocytosis, and degradation. b Differential gene expression between non- and Aβ-treated mhCOs in each knockdown. c Left, whole-mount immunostaining for CD11b in hCO, mhCO, and mhCOs with CRISPRi-mediated suppression of TREM2, SORL1, or CD33 at day 60. Right, quantification of the number of CD11b+ microglia-like cells/μm3. Data represent the mean ± SEM (n = 5, from three independent batches, two-sample t-test with Welch’s correction). The scale bar represents 100 μm. d Left, representative images of control hCO, mhCO, and mhCOs with CRISPRi-mediated suppression of Trem2, Sorl1, or Cd33 at 60-day-old with and without Aβ treatment. White arrowheads are showing damaged surfaces. Middle, schematic showing quantification of surface damages induced by Aβ treatment. Right, quantification of % of surface damage on organoids with and without Aβ treatment. Data are representative images of five organoids from three independent experiments. Bars indicate mean and SEM. The unpaired two-tailed t-test was used for all comparisons, ***p = 0.000149 for hCO and mhCO_SORL1 KD, ***p = 0.000003 for mhCO_TREM2 KD. The scale bar represents 0.5 mm. e Left, cleaved caspase-3 staining of organoids after 60-day culture with and without Aβ treatment. Right, quantification of cleaved caspase-3+/DAPI+ cells in hCOs and mhCOs at days 60 with and without Aβ treatment. Data represent the mean ± SEM (n = 6 organoids from three independent differentiation replicates of two hESC lines). The scale bar represents 50 μm.

