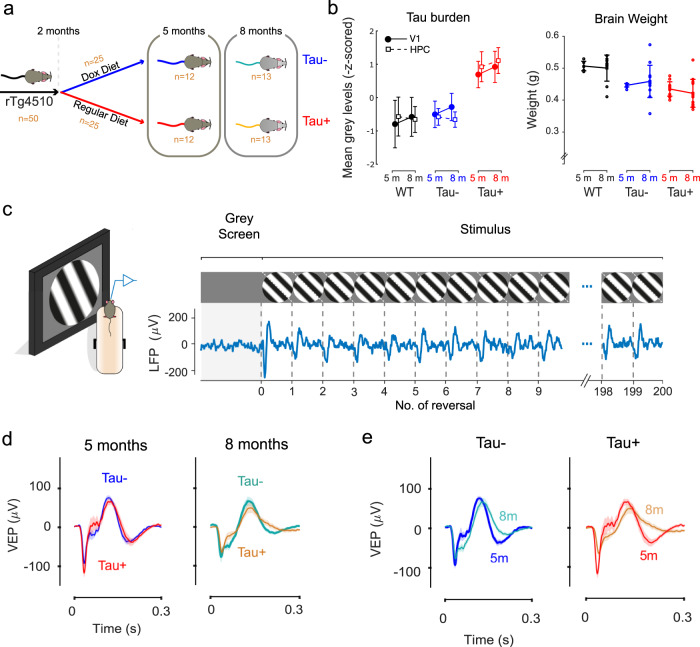
Fig. 1. Visual evoked responses in the primary visual cortex are largely preserved in tauopathy.
a 50 rTg4510 mice were used in this study. At 2 months of age, half the rTg4510 mice (n = 25) were treated with and fed doxycycline (Dox) to suppress the expression of the transgene and arrest further accumulation of Tau (Tau−). 12 of those Tau− mice were studied at 5 months of age and the other 13 at 8 months. Of the 25 mice fed a normal diet (Tau+), 12 were studied at 5 months and the remaining 13 at 8 months. Data from one 5-month old Tau+ mouse was subsequently removed from all electrophysiological analysis because the electrode was found to be placed too deep in the cortex (see “Methods”). b Left, comparison of average tau burden for each group of animals calculated as the mean grey levels within selected regions of interest in V1 and hippocampus (HPC) (“Methods”). Data are represented as mean ± 2*SEM. Right, comparison of overall brain weights at 5 months (5 m) and 8 months (8 m) timepoints. Data are represented as mean ± SEM. c Mice were head-fixed and allowed to run on a styrofoam wheel. After 5 min exposure to a homogenous grey screen, a full-screen, contrast reversing, sinusoidal grating pattern was presented to the left monocular visual field. The grating reversed every 0.5 s, and the animal was exposed to 10 blocks of 200 continuous reversals, with 30 s presentation of a grey screen between blocks. We recorded the local field potential (LFP) in the right primary visual cortex (V1). The LFP trace shown is the average time course across 10 stimulus blocks on one day in one Tau− mouse. Each reversal generated a visual evoked potential (VEP), characterised by an initial negative deflection and subsequent positive one. d Average VEP responses on the first day of recording for Tau− and Tau+ animals at 5 months (left) and 8 months (right). There was no significant difference in the size and shape of the VEPs between groups at either age (p = 0.75, two-way ANOVA). e Average VEP responses for Tau− (left) and Tau+ (right) mice obtained at 5 months and 8 months of age. VEPs were slightly reduced, and more sustained, for both Tau− and Tau+ mice at 8 months. Shaded area represents the mean±SEM (5-month-old: n=12 Tau−, n = 11 Tau+; 8-month-old: n = 13 Tau−, n = 13 Tau+). The source data underlying this figure are available in Supplementary Data 1.

