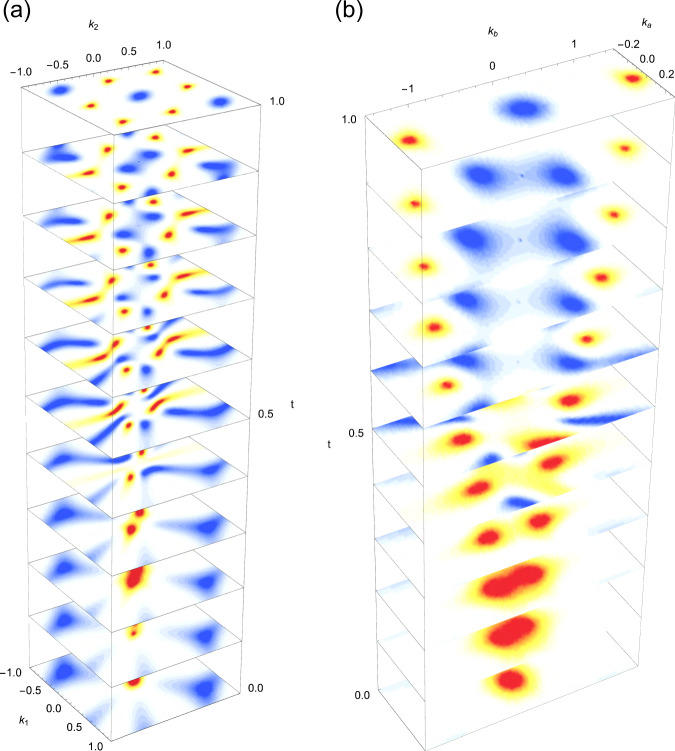
Fig. 7. Braiding patterns via C6 symmetry breaking.
Braiding within a three-band model of the group 1 of bands (see Fig. 2 in the main text) with broken C6 symmetry a over the entire Brillouin zone (k1, k2)/π ∈ [−1, 1]2, and b zooming around the Γ point. The red (blue) density plot corresponds to the nodes of gap 11 (gap 10), and the vertical axis t ∈ [0, 1] corresponds to the electric field from 0 eV/Å to 1.8 eV/Å. See Fig. 8 showing the detailed transfer of charge due to the braiding in the vicinity of Γ.

