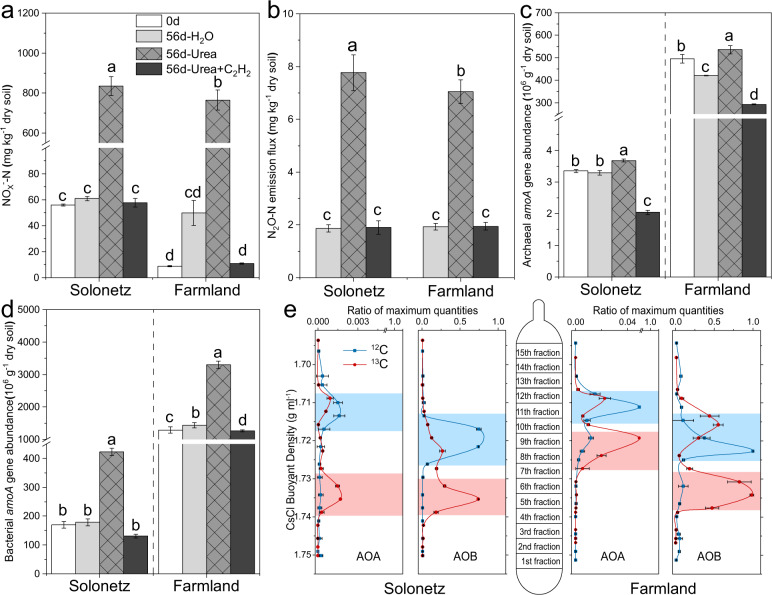
Fig. 2. Stable-isotope probing (SIP) of active ammonia oxidizers in solonetz and farmland soil.
Changes in the concentration of soil nitrite- plus nitrate-N (NOx−-N) (a), N2O emissions (b), and amoA gene abundances (c, d) of ammonia-oxidizing archaea (AOA) and bacteria (AOB) in SIP microcosms over an incubation period of 56 days. The 13C-DNA of AOA and AOB was revealed by quantitative analysis of archaeal and bacterial amoA gene abundances across the entire buoyant density gradient of the fractionated DNA from SIP microcosms at day 56 (e). SIP microcosms were incubated with either 13C (CO2 and urea) or 12C (CO2 and urea), and an equal volume of H2O instead of urea solution was amended as a control to monitor nitrification activity due to ammonia released from soil mineralization. The designations “0 d” and “56 d” denote days 0 and 56, respectively. “56 d-H2O” and “56 d-urea” indicate samples from microcosms that received water or urea every seven days, respectively. The designation “56d-Urea+C2H2” represents the sample at day 56 from SIP microcosms incubated with both urea and 100 Pa C2H2. Different letters above the columns indicate significant differences (p < 0.05) (a, b). Different letters above the columns in each soil indicate significant differences (p < 0.05) (c, d). The data are normalized units (e) using the ratio of the amoA gene copy number in each DNA gradient fraction to the maximum quantity of two soils, and the “13C-DNA” (“heavy DNA”) and “12C-DNA” (“light DNA”) fractions are indicated by the shaded rectangles in red and blue, respectively.

