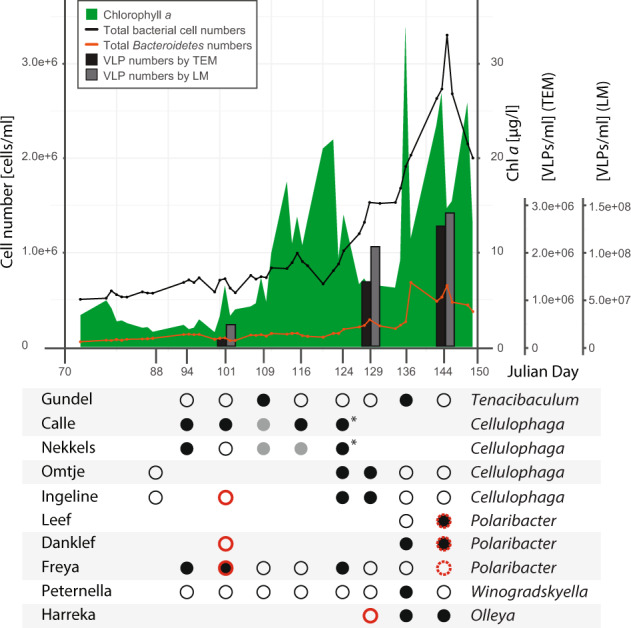
Fig. 1. Flavophage detection during the 2018 spring phytoplankton bloom, as inferred from phage isolation and metagenome read mapping.

Upper panel: Results are presented in the context of chlorophyll a concentration (green), total bacterial cell numbers (black line), Bacteroidetes numbers (orange line), phage numbers by transmission electron microscopy (TEM, black bar), and phage numbers by epifluorescence light microscopy (LM, gray bar). Lower panel: Phage isolation is shown for different time points (x axis, Julian days), with the phage identity verified by sequencing (black dots) or not determined (gray dots). Most of the isolations were done by enrichment, and some by direct plating (asterisks). Phage detection in metagenomes was performed by read mapping, with a 90% read identity threshold for phages in the same species (full red circles) and 70% read identity threshold for related phages (dashed red circles). Alternating gray shading of isolates indicates phages belonging to the same family.
