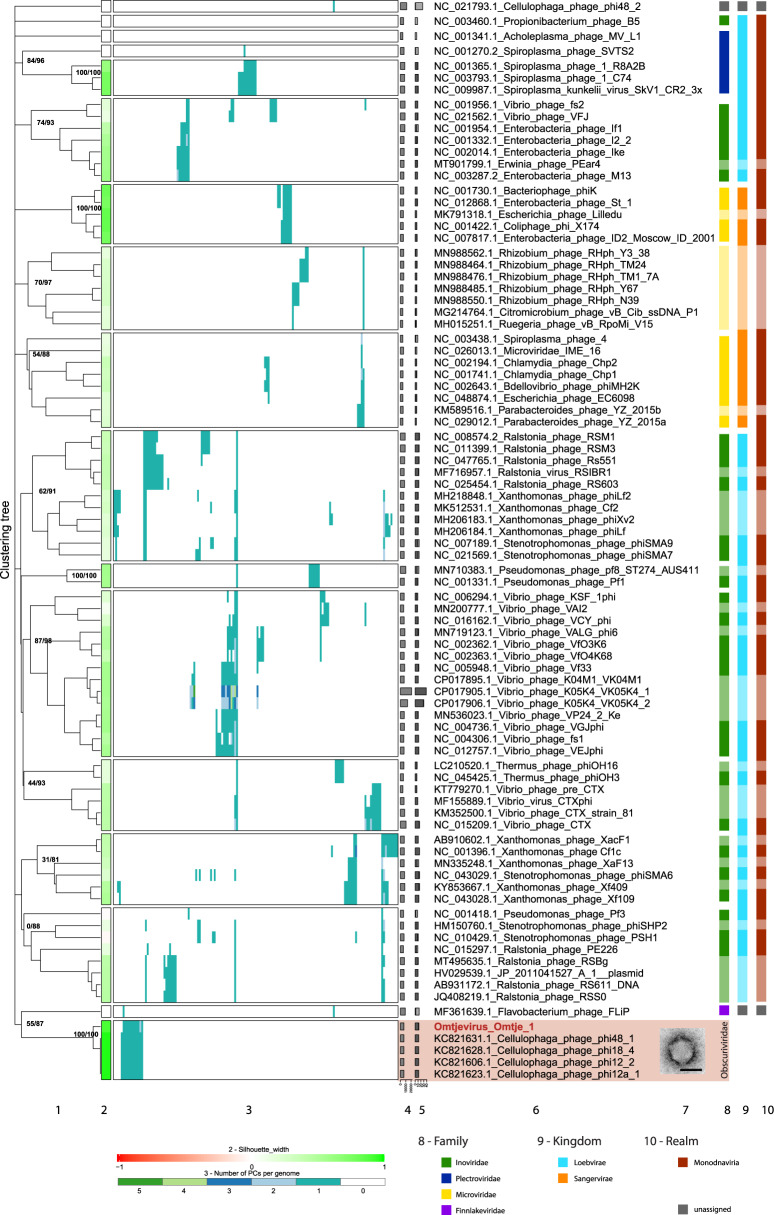
Fig. 4. VirClust hierarchical clustering of the new ssDNA flavophages and their relatives, based on intergenomic distances calculated using the protein cluster content.
1. Hierarchical clustering tree. Two support values, selective inference (si [99]) and approximately unbiased (au [100]) are indicated at branching points (si/au) only for the major clades (see SI file 1 Figs. 16 and 17 for all support values). The tree was cut into smaller viral genome clusters (VGCs) using a 0.9 distance threshold. Each VGC is framed in a rectangle in 2 and 3. 2. Silhouette width, measures how related is a virus with other viruses in the same VGCs. Similarity to other VGCs is indicated by values closer to -1 (red). Similarity to viruses in the same VGC is indicated by values closer to 1 (green). 3. Distribution of the protein clusters (PCs) in the viral genomes. 4. Genome length (bps). 5. Fraction of proteins shared with other viruses (dark gray), based on protein assignment to PCs. 6. Virus names, with flavophages isolated in this study marked in red. 7. TEM image of the new flavophage, uranyl acetate negative staining. Scale bar in TEM image has 50 nm. 8. Family (ICTV). 9. Kingdom (ICTV). 10. Realm (ICTV). Lighter colors in columns 8–10 represent phages not recognized by the ICTV, but by publications.

