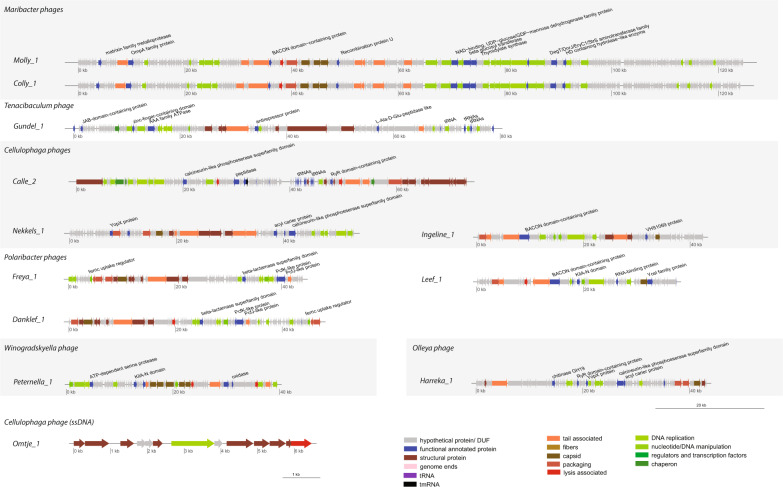
Fig. 5. Genome maps of phage isolates with color-coded gene annotations.
Genomes of one representative of each new phage species are shown and depicted at the same scale to allow phage genome size comparisons. Due to its small genome Omtje is not at the same scale. Genes are color-coded by annotation and specific functional annotated proteins are indicated at genomes. Alternating gray shading indicates phages of the same host genus.

