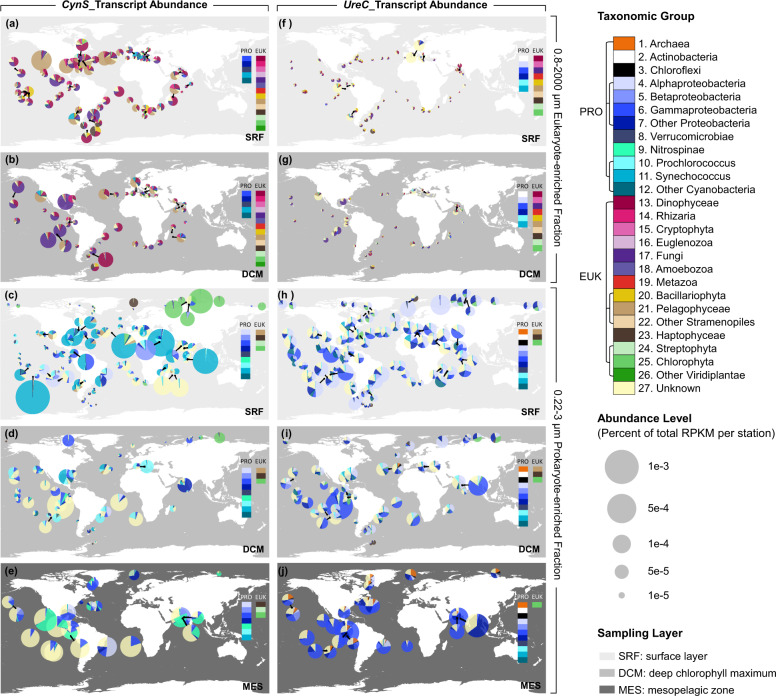
Fig. 2. Biogeographic distribution and taxonomic composition of cynS and ureC transcripts in the global ocean from the surface (SRF) to the deep chlorophyll maximum (DCM) and the mesopelagic (MES).
CynS (a–e) and ureC (f–j) in eukaryote-enriched (0.8–2000 μm fraction) and prokaryote-enriched (0.22–3 μm fraction) metatranscriptomes. Samples from different size fractions have been pooled in each station. No data are available for 0.8–2000 μm fraction in MES.

