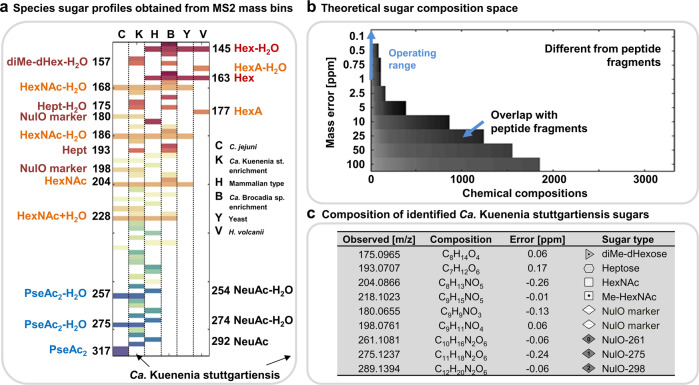
Fig. 2. Carbohydrate profiles obtained from the anammox enrichment cultures (and reference samples) using the MS2 mass binning approach.
a The graph (from left to right) shows the carbohydrate profiles (m/z values are distributed along the y-axis) from the C. jejuni sample (C, control), Ca. Kuenenia stuttgartiensis enrichment culture (K), HEK protein sample (H, control), Ca. Brocadia sapporoensis enrichment culture (b), S. cerevisiae sample (Y, control) and H. volcanii sample (V, control). The carbohydrate profiles of the control samples established by the MS2 mass binning approach reflected the known oligosaccharide compositions of the individual species. Only sugar components, which commonly provide only very low abundant or no carbohydrate related fragments (oxonium ions), such as deoxy hexoses, were not observed. NulO and HexNAc fragments are prominent in the C. jejuni proteomics sample, NeuAc/HexNAc and Hex related signals in the HEK derived sample, HexNAC- and hexose-related signals in the S. cerevisiae (yeast) proteomics sample, and hexuronic acid (HexA)- and hexose (Hex)-related signals in the H. volcanii sample. The latter was cultured at high salinity; therefore, the proteins appeared modified by only a single type of glycan structure. Fragments with the same color indicate water loss clusters (-H2O), which are a characteristic consequence of the oligosaccharide chain fragmentation process, and therefore indicators for the discovery process. The mass compositions and sugar type annotations for the Ca. Kuenenia stuttgartiensis enrichment proteome are detailed in the table on the right (c). The abbreviations “NulO” stand for nonulosonic acid, “NeuAc” for N-Acetyl neuraminic acid; “Pse” for pseudaminic acid; “HexNAc” for N-Acetyl-hexose amine; “Hept” for heptose; “Hex” for hexose; “HexA” for hexuronic acid; “dHex” for deoxyhexose and “Me” for methyl, respectively. The sugar symbols are depicted in generic white and gray shades because a further classification into specific types of monosaccharides, beyond sum formulae, chain length and modifications, cannot be obtained from accurate mass experiments. The different gray scales were simply chosen to make the individual sugar symbols more distinguishable within graphs and depicted oligosaccharide structures (b) The constructed carbohydrate chemical composition space. A large chemical composition space was constructed (>3300 theoretical compositions) used to assign chemical compositions to non-peptide related features. At high mass resolution (>100 K) and accuracy (<1 ppm), the mass overlap with amino acid-related fragments is considerably low. Mass recalibration using frequently observed amino acid fragments enables to operate at very high mass accuracy (blue arrow) “(color figure online)”.

