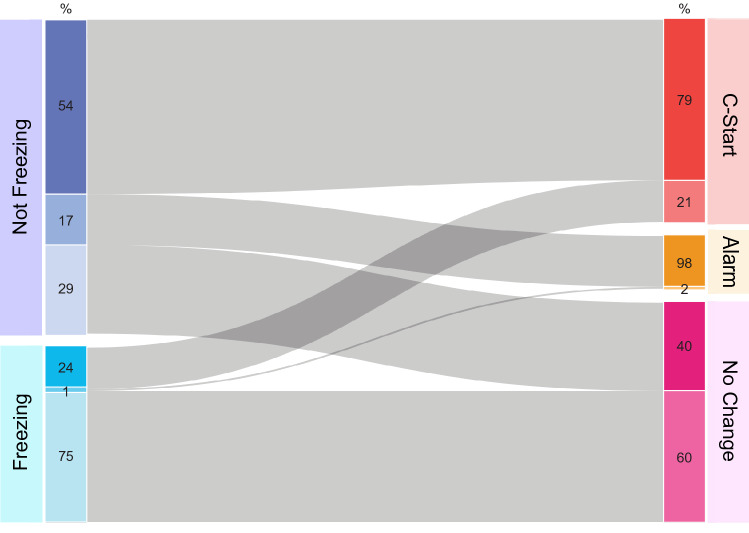
Figure 2.
Risk assessment is affected by prior motor state. Alluvial diagram of fish motor behavior in each trial before and after stimulation. The diagram shows the motor state before (Not Freezing, n = 1003, N = 156 or Freezing, n = 580, N = 121) and after sensory stimulation (C-start, n = 675, N = 164; Alarm, n = 176, N = 98; No change in motor behavior, n = 732, N = 166) combining all stimulus conditions. Each motor state is further divided by its “future” or “past” action (numbers within colored boxes). For example, 54% of non-freezing animals executed a C-start, while 60% of animals that did not changed their motor behavior were freezing before stimulation.

