
Fig. 3. Nonlinear and linear response to climatic forcing of MB models.
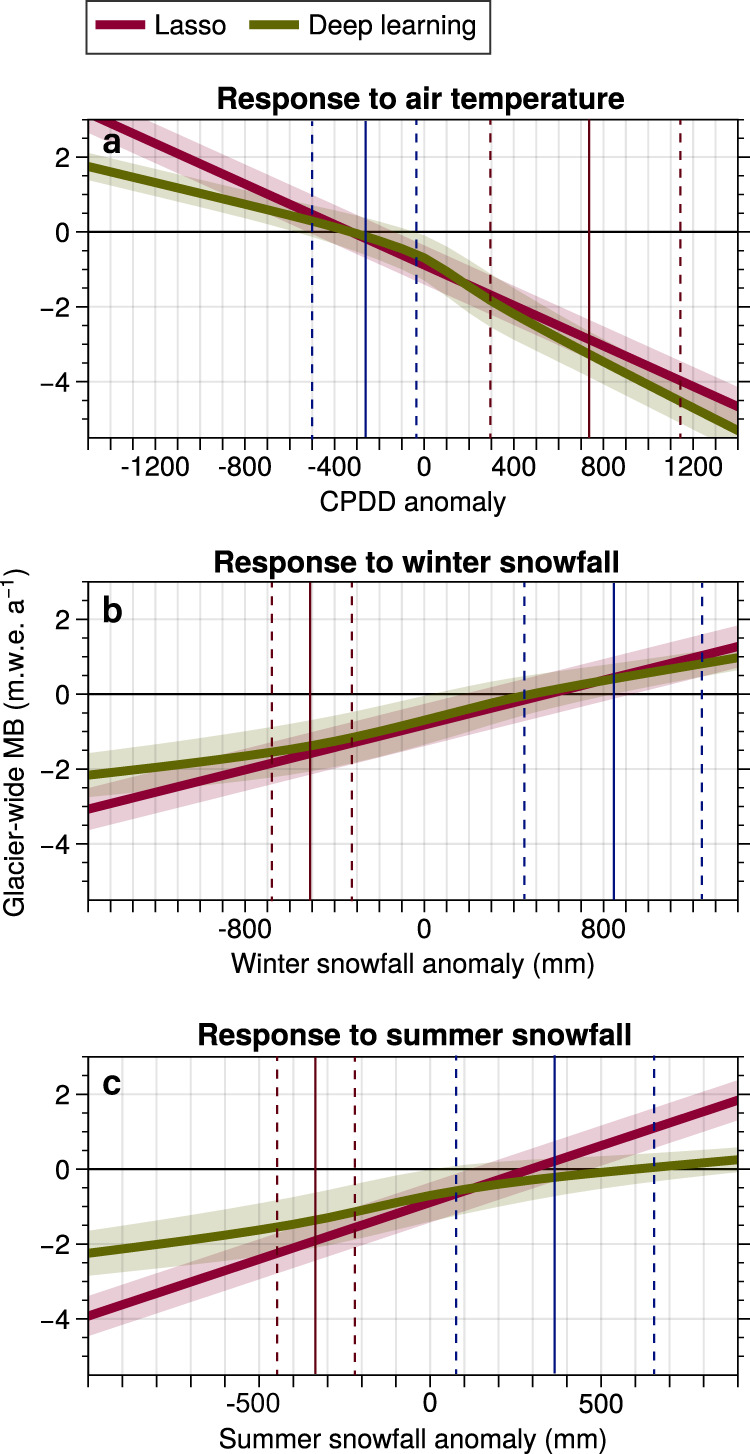
Nonlinear deep learning response and linear Lasso response to a Cumulative positive degree days (CPDD) anomalies, b winter snowfall, and c summer snowfall. All climate anomalies are computed with respect to the 1967–2015 mean values. Envelopes indicate ±σ based on results for all 660 glaciers in the French Alps for the 1967–2015 period. The vertical blue and red lines indicate the distribution of extreme (top 5%) values for all 21st century projected climate scenarios, with the mean value in the center and ±1σ indicated by dashed lines.