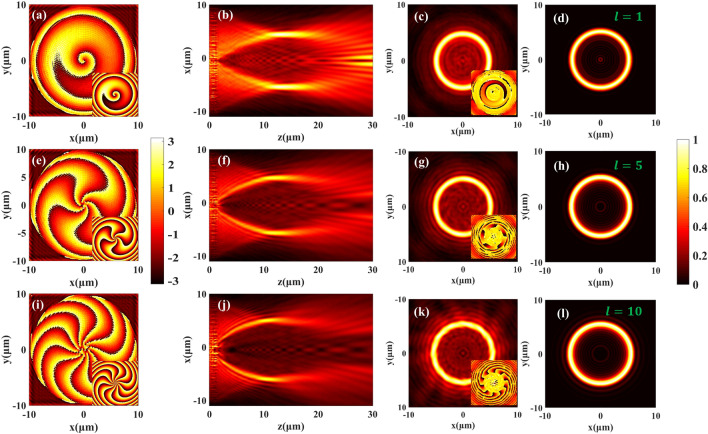
Figure 2.
The phase and electric field distributions of Q-PVs. (a,e,i) The simulated phase distribution after the metasurface when l equals 1, 5, and 10, respectively. The insets show the designed phase distributions. (b,f,j) The longitudinal section of the Q-PV light field on the xOz plane; (c,g,k) The simulated electric field intensity distributions in the focal planes and the insets represent the corresponding phase distributions; (d,h,l) The theoretical light field calculated by Fresnel integration diffraction theory. All the simulated light field distributions were normalized.

