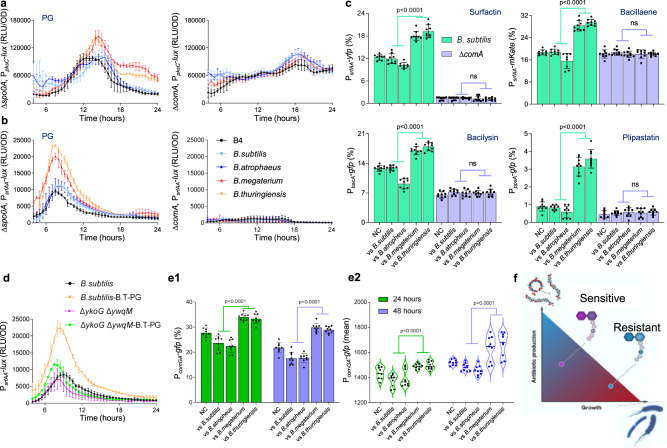
Fig. 8. ComA and PG receptors mediate the recognition of sensitive competitors.
a, b Analysis of the luciferase activity in WT B. subtilis strain harboring PpksC-lux (bacillaene) and PsrfAA-lux (surfactin) reporters and their indicated mutants. Luminescence was monitored in B4 medium (No Treatment), and B4 medium supplemented with PG (100 ng/µl) from the indicated species. Graphs represent mean ± SD from three independent experiments (n = 9). c WT B. subtilis strains harboring PsrfAA-yfp (surfactin), PpksC-mKate (bacillaene), PbacA-gfp (bacilysin) and PppsA-gfp (plipastatin) reporters and their ∆comA mutants were grown either alone (NC) or in competition against indicated Bacilli, and their cells were analyzed using flow cytometry. Graphs represent mean ± SD from three independent experiments (n = 9). d Analysis of the luciferase activity in WT B. subtilis strain harboring PsrfAA-lux (surfactin) reporter and its ∆ykoG ∆ywqM mutant. Luminescence was monitored in B4 medium (No Treatment), and B4 medium supplemented with PG (100 ng/µl) from B.thurngiensis (B.T-PG). Graphs represent mean ± SD from three independent experiments (n = 9). e A WT B. subtilis strain harboring PcomGA-gfp reporter were analyzed either alone (NC) or in competition against indicated Bacilli using flow cytometry.; Y-axis represents (e1) the % of cells expressing the reporters (e2) Violin plots showing intensity of the fluorescent population, data is presented as median (solid line) with 25th and 75th percentile (dashed line) from three independent experiments (n = 9). f A conceptual model of the conflict between growth and antibiotic production, and how it is resolved by the PG mediated regulation of antibiotic production. For panels a, b and d statistical analysis was performed using two-way ANOVA followed by Dunnett’s multiple comparison test. For panels c and e statistical analysis was performed between resistant and sensitive members using Brown–Forsthye and Welch’s ANOVA with Dunnett’s T3 multiple comparisons test. P < 0.05 was considered statistically significant. P values at different time points in panels a, b and d are shown in the Supplementary Data 1. Source data are provided as a Source Data file.

