Fig. 2.
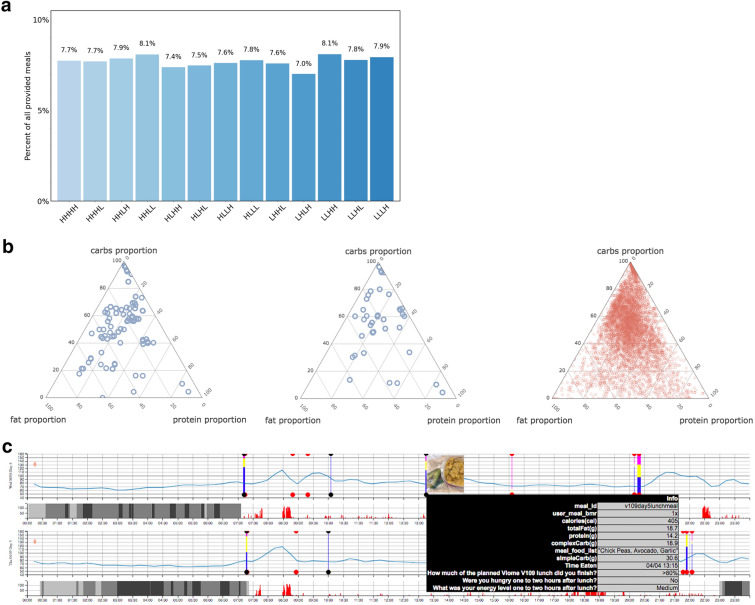
Study meal design and content. a Percentage of each meal category within all 18,000+ provided meals. Categories were defined using proportions of carbs (H/L), fiber (H/L), proteins (H/L), and fats (H/L). b Macronutrient proportions of all 71 unique pre-designed omnivore meals (top, blue), all 33 unique pre-designed vegetarian/gluten-free meals (middle, blue), and all free meals (bottom, red). Provided meals account for 66% of all meals, and free meals 34%. c Data collected for a single participant over 2 days (out of 14). Each row is a single day. The blue curve is the CGM reading collected every 15 min. Vertical bars are meal events, showing carbs proportion (blue), fat proportion (yellow), and protein proportion (pink). The user interface also visualizes a picture of the meal and the nutrient details. Gray bars represent light and deep sleep. The red histogram next to sleep bars is the tracked physical activity

