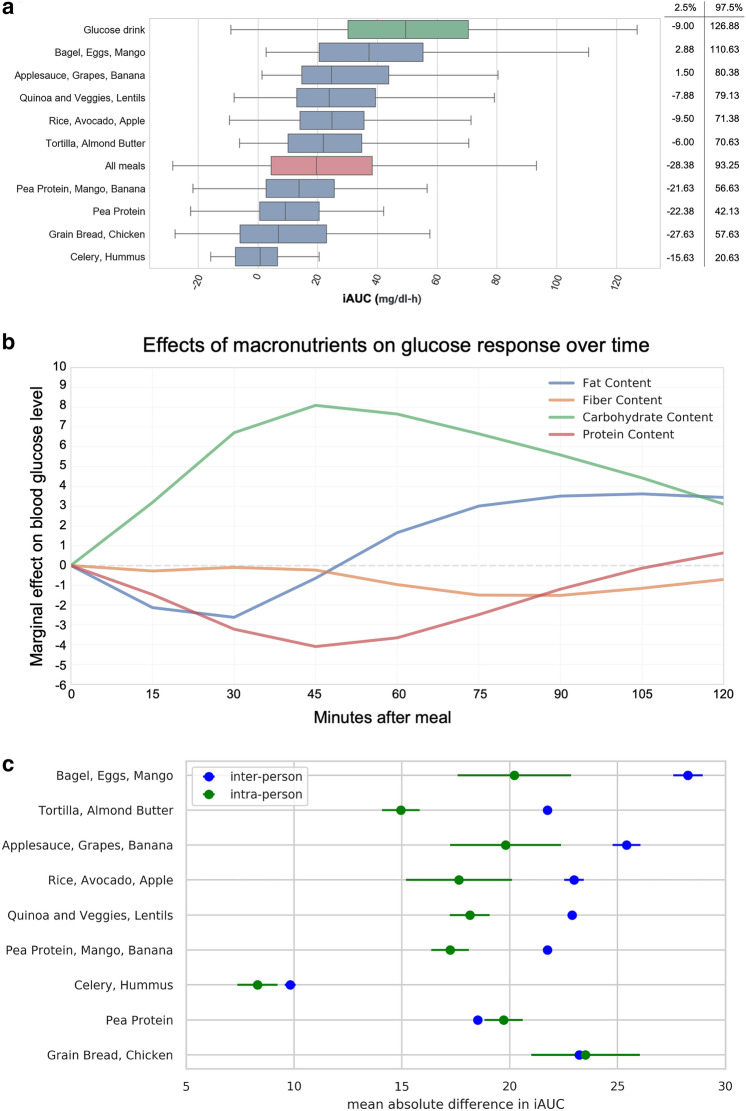
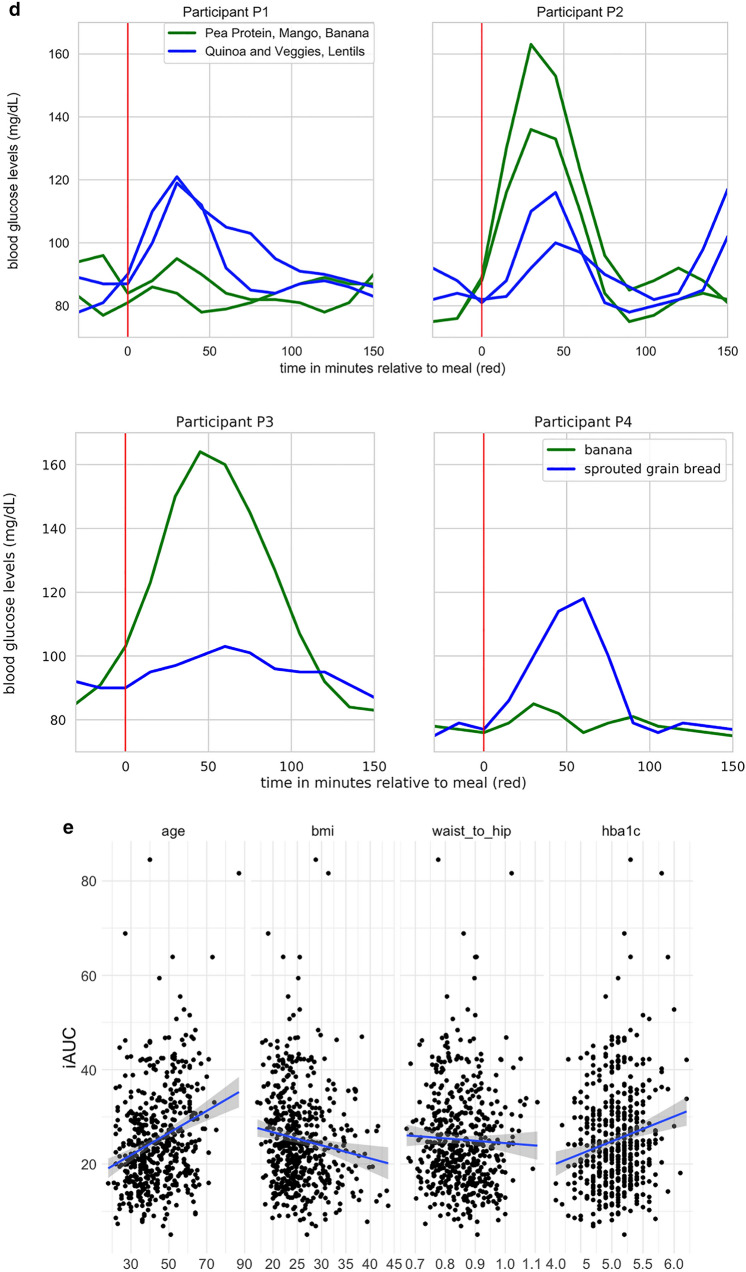
Fig. 3.
Overview of postprandial glycemic response data. a iAUC values (in mg/dl-h) for all meals, provided and free (red bar); the 9 repeated meals from Table 3, (blue bars); and the glucose drink (green bar). Boxplots show the interquartile range; whiskers cover the middle 95th percentile. b Marginal effect of macronutrients on glucose response over time, across all meals, across all participants. Each timepoint is a linear regression of iAUC on all four standardized macronutrients. c Inter- and intra-person variability for 9 repeated provided meals. Inter-person variability represents differences across multiple people. Intra-person variability represents differences for a single person between the two times each meal was consumed. X axis is the mean absolute difference in iAUC. Points indicate the mean absolute difference in response between two consumptions of the meal by one person (green), and mean absolute difference in response between all pairs of different people (blue). Bars indicate standard error. Y axis is in descending order of difference between inter-person and intra-person variability. d Examples of individual variation in glycemic response. Participants P1 and P2: Ingestion of two of the repeated meals (blue and green lines) result in opposite blood glucose response in two participants (top). Participants P3 & P4: Ingestion of two free meals results in opposite blood glucose response in two participants (bottom). e Relationships between anthropometric characteristics and per-participant average iAUC across all meals (provided free)


