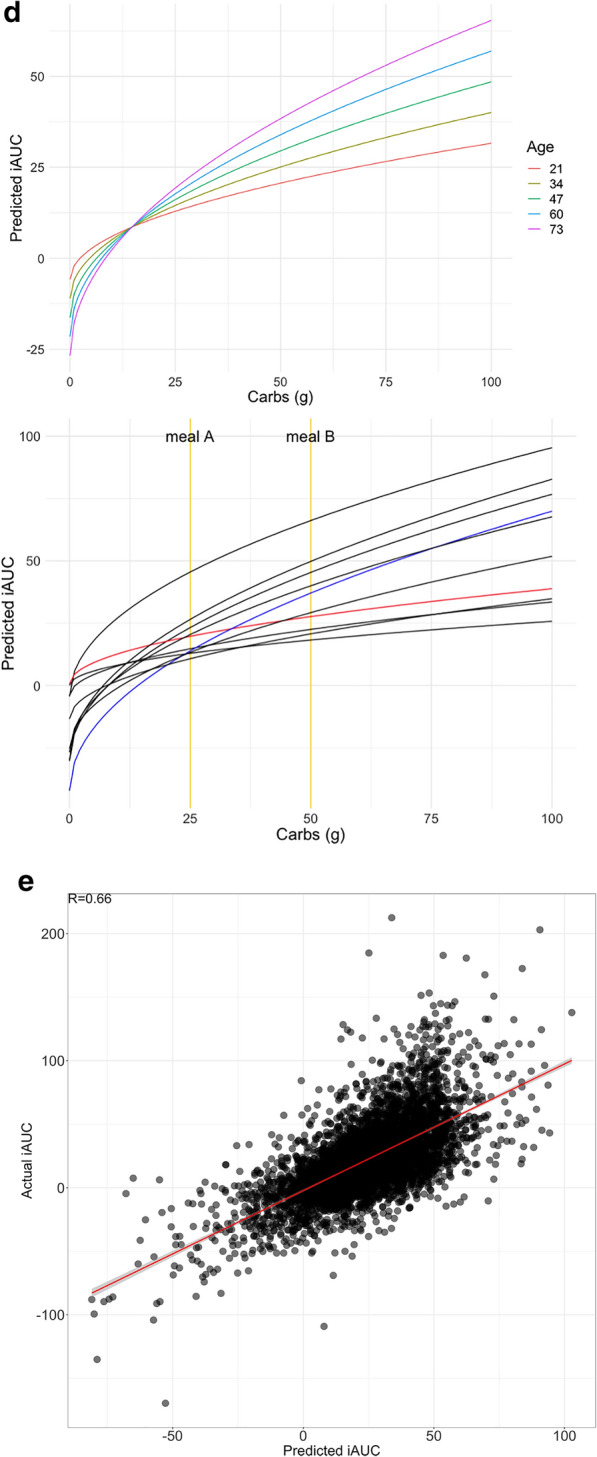
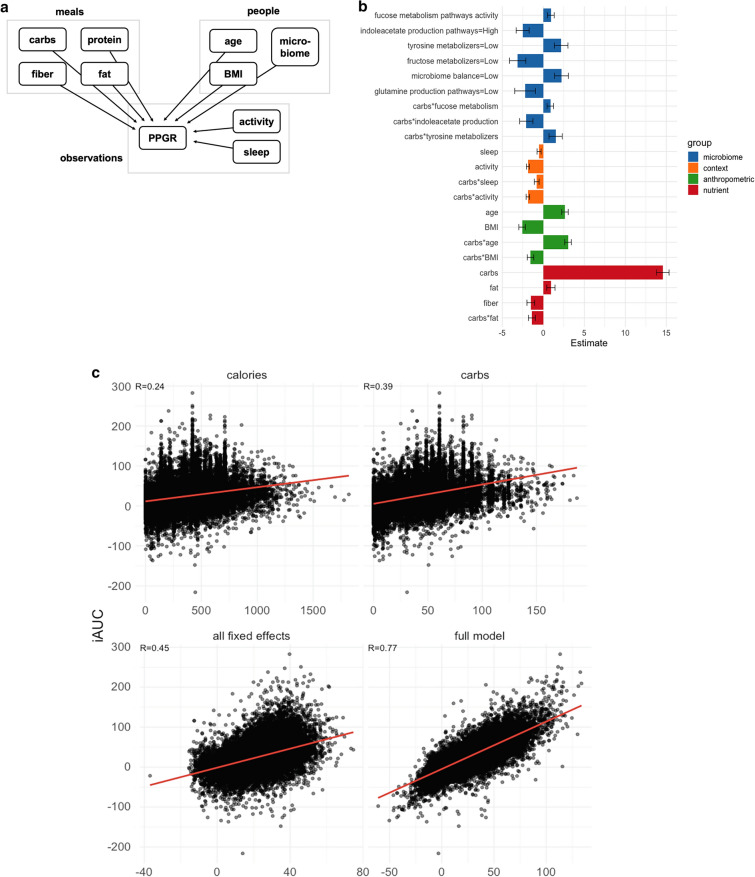
Fig. 4.

Models for predicting PPGR. a Nesting of predictors in our repeated-measures crossed experimental design. Plates (boxes) indicate repetition: e.g., there is one measurement of carbs, protein, fiber, fat for each meal. Arrows indicate the possibility of dependence: here, PPGR is estimated as a function of all other variables. b Fixed-effect estimates for all predictors included in the final model. Continuous predictors are standardized (mean is zero, units are standard deviations), meaning the expected response changes by the value of the coefficient when the predictor changes by one standard deviation. All microbiome scores except fucose are binary scores, meaning the coefficient is the difference in expected response between the two levels of the score. Error bars show standard error of the estimate. c Actual glycemic response (iAUC) against (a) calories, (b) carbs, (c) predictions from the model including all fixed effects (standard linear regression), and (d) the fit of the full mixed-effects model. d (left) Model predictions as a function of carbs and age, holding all other predictors at the baseline. (right) Model predictions as a function of carbs for 10 randomly sampled people, taking into account all person-level fixed and random effects and holding all other nutrient and context variables at the baseline. Two users are highlighted (red and blue) to draw attention to the flip in their predicted response to the two example meals A and B annotated in yellow. e Actual vs predicted iAUC for a gradient boosting machine (GBM) model. Performance shown is on the best test fold across 5 random splits, with data from 82% of the users used to train and 18% held out for evaluation

