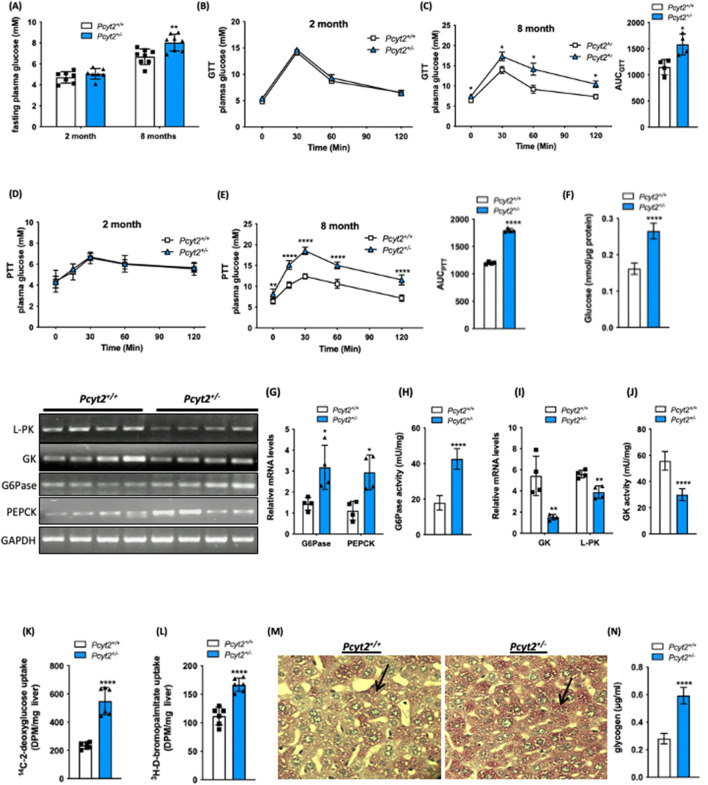
Figure 1.
Glucose metabolism is altered in older Pcyt2+/− mice. (A) Fasting glucose levels for 2-mo and 8-mo Pcyt2+/+ and Pcyt2+/− mice. (B) Intraperitoneal glucose tolerance test for 2-mo and (C) 8-mo Pcyt2+/+ and Pcyt2+/− and area under the curve (n = 4). (D) Intraperitoneal pyruvate tolerance test for 2-mo and (E) 8-mo Pcyt2+/+ and Pcyt2+/− and area under the curve (n = 4). (F) Glucose production in primary hepatocytes (n = 12). (G) Relative mRNA expression levels of gluconeogenic enzymes G6Pase and Pepck (n = 4) and (H) G6Pase enzymatic activity (n = 12) in 8-mo Pcyt2+/+and Pcyt2+/− mice. (I) Relative mRNA expression levels of glycolytic enzymes Gk and L-Pk (n = 4) and (J) GK enzymatic activity (n = 12) in 8-mo Pcyt2+/+ and Pcyt2+/− mice. (K) [14C]deoxyglucose and (L) [3H]bromopalmitate uptake in liver (n = 6). (M) Periodic acid-Schiff staining of liver sections for glycogen in 8-mo Pcyt2+/+ and Pcyt2+/− mice. (N) Liver glycogen content of 8-mo Pcyt2+/+ and Pcyt2+/− mice (n = 12). Band intensities were measured using ImageJ. Data are presented as mean ± SD. *p < 0.05; **p < 0.01; ***p < 0.001; ****p < 0.0001.

