Figure 2.
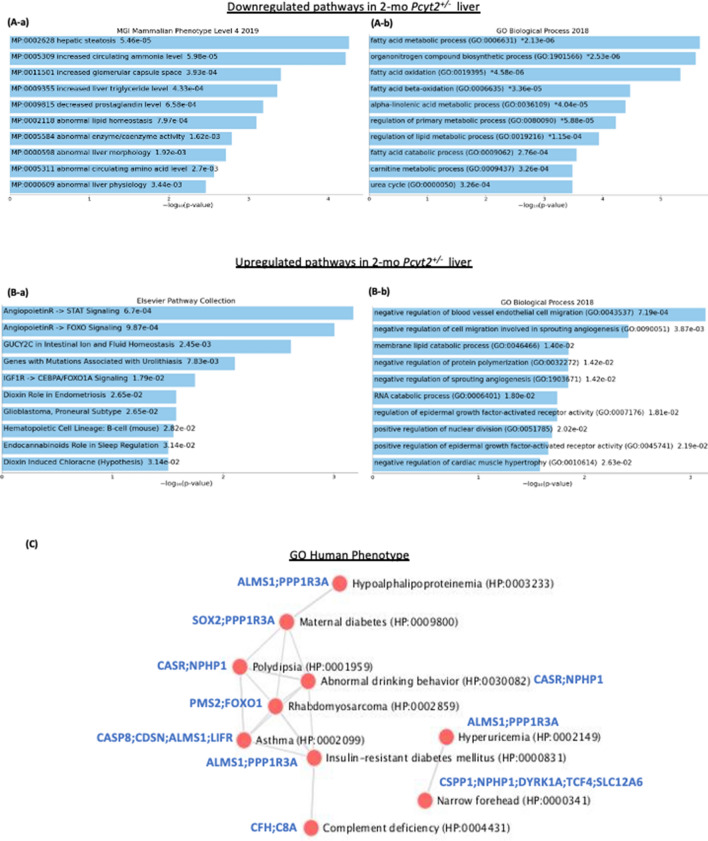
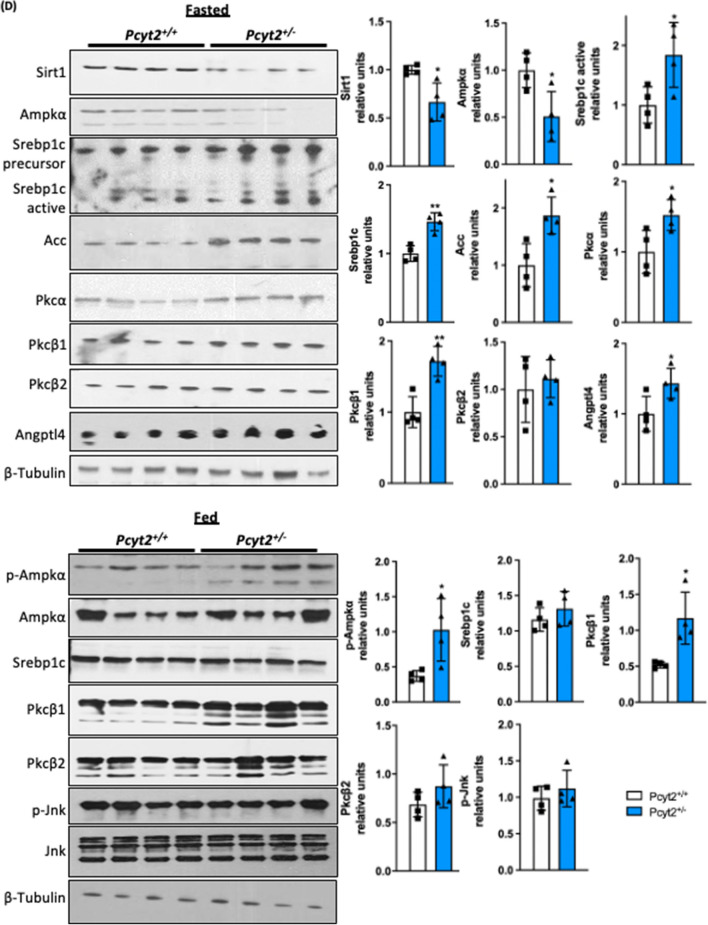
Analysis of down- and upregulated pathways in 2-mo Pcyt2+/− liver. (A) Downregulated genes from 2-mo Pcyt2+/− liver were analyzed with Enrichr (https://maayanlab.cloud/Enrichr/)33–35 (n = 3). (A-a) Pathway analysis (MGI Mammalian Phenotypes Level 4–2019) established the most enriched terms include hepatic steatosis and increased circulating ammonia. (A-b) The Gene Onthology (GO) analysis (GO Biological Processes 2018) further shows that the most significantly downregulated were processes of fatty acid oxidation and nitrogen degradation. The most frequently downregulated GO genes from phospholipids and fatty acid metabolism and nitrogen (urea cycle, arginine) are indicated in the clustergram. (B) Upregulated genes from 2-mo Pcyt2+/− liver were analyzed with Enrich (n = 3). (B-a) The cluster analysis for the Elsevier Pathway Collection identified as elevated the Igf2- and Ang4/Ang2-Foxo1 pathways and ion/amino acid transport. (B-b) GO Biological Processes 2018 of the most upregulated genes identified as the most important the processes linked to Ang2/Ang4 functions in regulation of angiogenesis and Egfr signaling. (C) Go:Human Phenotype establish a gene/disease network for young Pcyt2+/− with significant risk for development of maternal- and type 2- diabetes and related pathologies. (D) Immunoblot analysis of lipid pathways in fasted and fed Pcyt2+/+ and Pcyt2+/− (n = 4). Band intensities were measured using ImageJ. Data are presented as mean ± SD. *p < 0.05; **p < 0.01.


