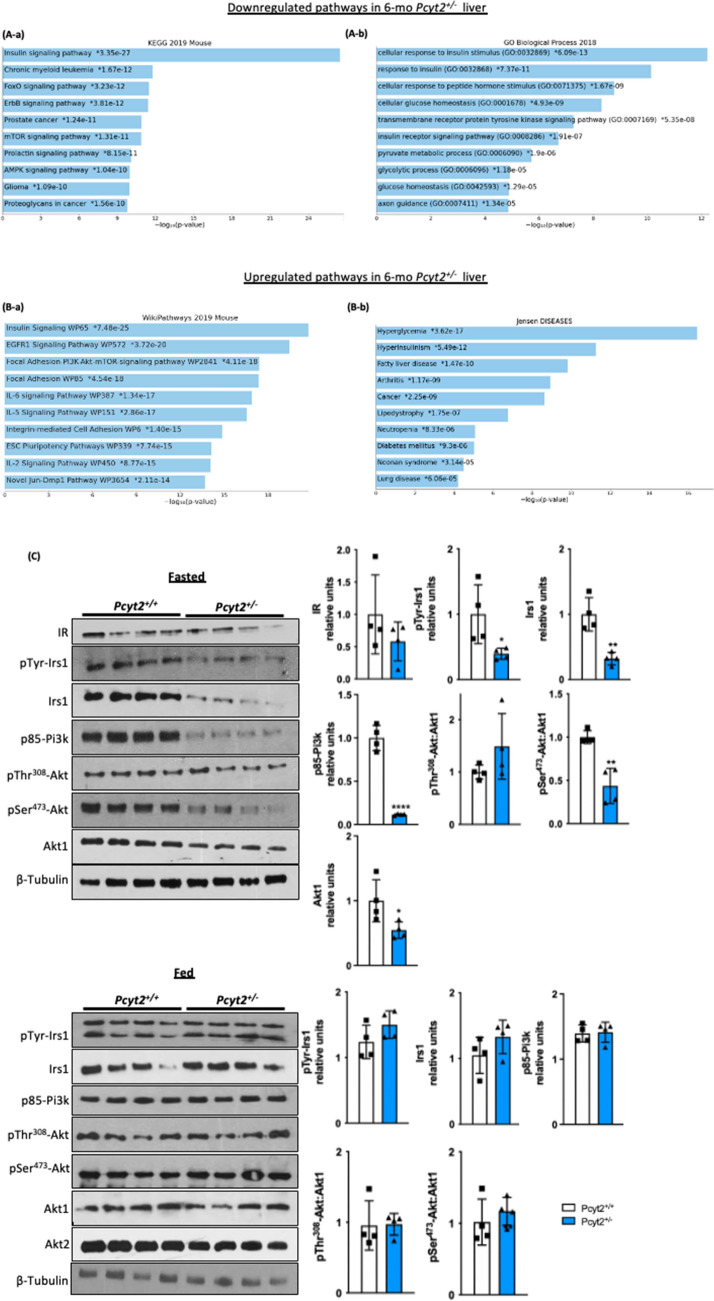
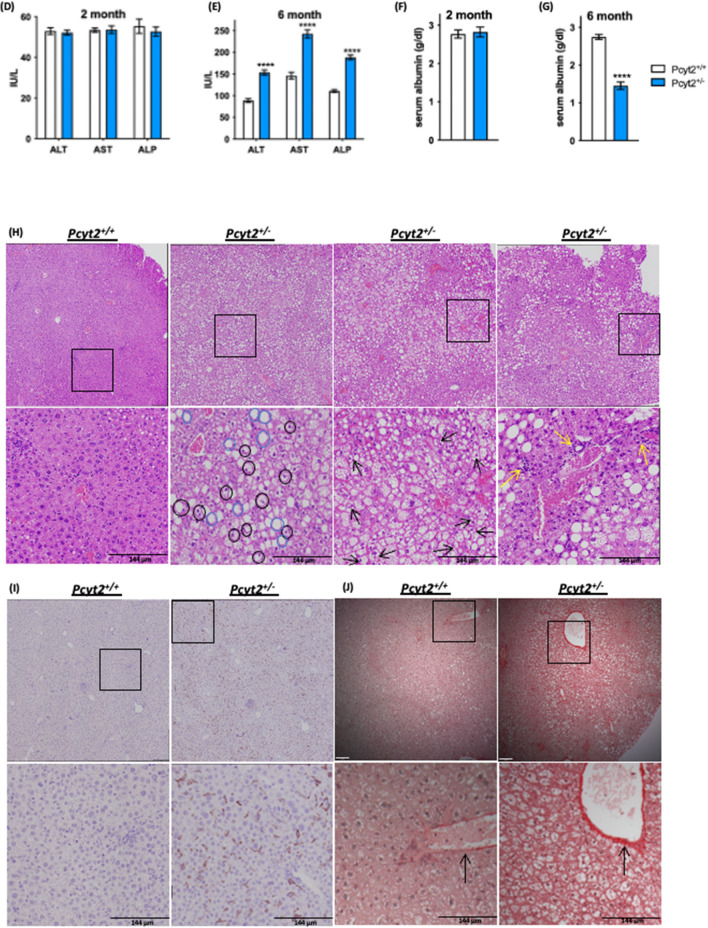
Figure 3.
Analysis of down- and upregulated pathways in 6-mo Pcyt2+/—liver. (A) Downregulated genes of 6-mo Pcyt2+/− liver were analyzed with Enrichr (https://maayanlab.cloud/Enrichr/)33–35 (n = 3). (A-a) The Mouse 2019 KEGG38–40 pathway analysis and genes cluster analysis indicated that the most downregulated pathways included the growth factor (insulin, ErB, prolactin, cancer) pathways, and mTOR and AMPK pathways. (A-b) GO Biological Processes 2018 showed that the most downregulated processes were insulin signaling and glucose metabolism. (B) Upregulated genes of 6-mo old Pcyt2+/− were analyzed with Enrich (n = 3). (B-a) WikiPathway Mouse 2019 established the most significantly upregulated gene clusters and pathways for insulin/EGFR signaling and pro inflammatory pathways mediated by IL2, IL9, IL5, IL6, and IL7 (B-b) Jansen Diseases analysis showed that the most upregulated were gene involved in hyperglycemia, hyperinsulinemia, and fatty liver disease. (C) Immunoblot analysis of Pi3k/Akt pathway in fasted and fed 6-mo Pcyt2+/− (n = 4). Serum levels of liver enzymes ALT, AST, ALP in (D) 2-mo and (E) 6-mo Pcyt2+/− (n = 12). Serum levels of albumin in (F) 2-mo and (E) 6-mo Pcyt2+/− (n = 12). Histology of 8-mo liver with (H) H&E stain showing steatosis (blue circles), ballooned hepatocytes (black circles) with Mallory-Denk bodies (black arrows) and lobular inflammation (yellow arrows); (I) immunohistochemical stain with F4/80 showing macrophage infiltration; (J) Picrosirius red stain showing collagen deposition. Band intensities were measured using ImageJ. Data are presented as mean ± SD. *p < 0.05, **p < 0.01, ***p < 0.001, ****p < 0.0001.


