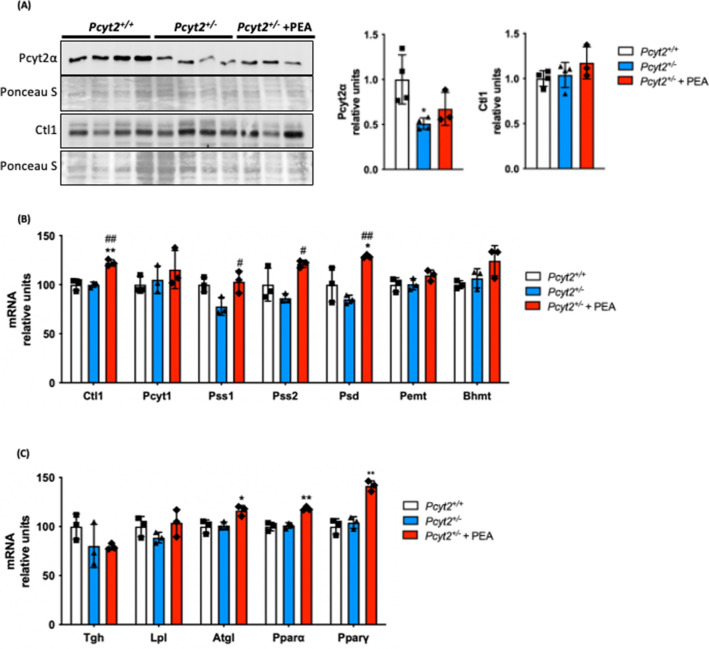
Figure 4.
PEA stimulates phospholipid and triglyceride metabolic genes. (A) Immunoblot analysis of liver Pcyt2α and Ctl1 in 8-mo Pcyt2+/+, Pcyt2+/− and Pcyt2+/− + PEA mice treated for 12 weeks (n = 3–4). mRNA analysis of (B) phospholipid and (C) lipid metabolism genes in Pcyt2+/+, Pcyt2+/− and Pcyt2+/− + PEA mice. GAPDH used as loading control. Band intensities were measured using ImageJ. Membranes were cut prior to antibody hybridization to allow for the probing of multiple targets on one membrane. Data are presented as mean ± SD. *p < 0.05, **p < 0.01 relative to Pcyt2+/+; #p < 0.05, ##p < 0.01 relative to Pcyt2+/−.

