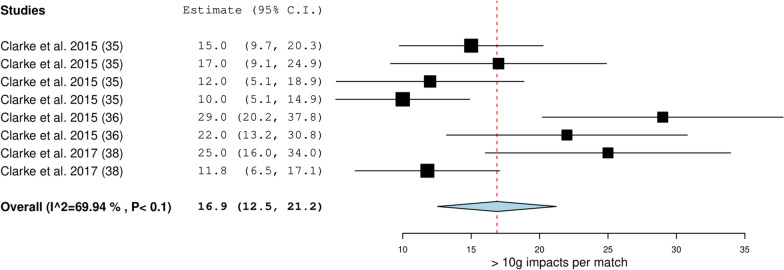
Fig. 4.
Meta-analysis of studies reporting absolute > 10 g impacts per match (n) from microtechnology in sevens. The forest plot (mean and 95% confidence interval (CI)) presents the results of the meta-analysis of the pooled data estimates for the absolute > 10 g impacts frequency per match. The squares and horizontal lines represent individual study mean and 95% CI and the diamond presents the pooled mean and 95% CI. The bigger the square the larger the sample size

