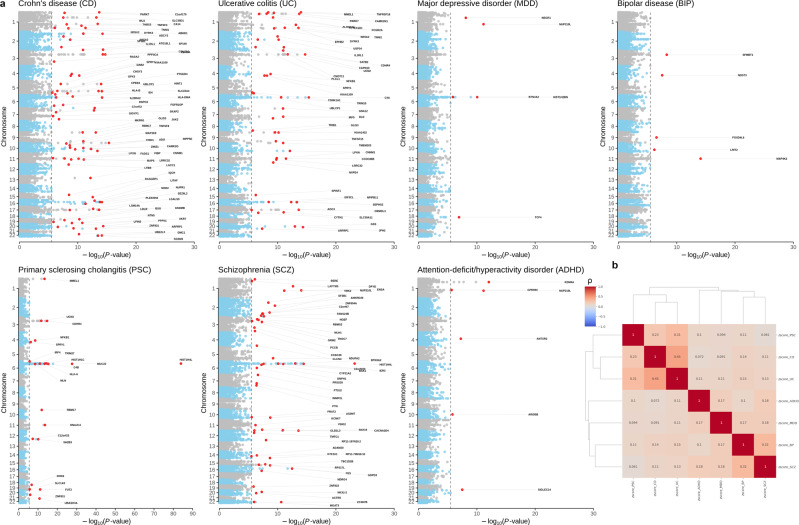
Fig. 2. Manhattan plots showing transcriptome-wide significant (Pconditional < 3.20 × 10⁻⁶ from GBJconditional) gene discoveries for psychiatric and immune phenotypes in 23 gut-brain-axis (GBA) tissues, and proportion of shared predicted transcriptome-wide disease-associated gene expression (ρE) for pairs of immune-mediated and psychiatric diseases averaged across 23 tissues of the GBA.
a Gray dotted line, transcriptome-wide significance threshold; red dots, lead gene-disease associations at TWAS loci (for regions of size ±1 Mb) and conditioned on all genes within ±1 Mb regions. CD Crohn’s disease, UC ulcerative colitis, PSC primary sclerosing cholangitis, SCZ schizophrenia, MDD major depressive disorder, BIP bipolar disease, ADHD attention-deficit/hyperactivity disorder. b Spearman’s trait correlation (ρ) values at the transcriptome-wide level of gene expression for each disease pair and averaged across 23 tissues of the GBA show that effects of genetic risk variants shared between psychiatric and immune phenotypes are largely mediated by gene expression. Strongest positive correlations across psychiatric and immune phenotypes were observed for pairs UC and BP (E = 0.15), CD and BP (E = 0.14), UC and SCZ (E = 0.13), and CD and SCZ (E = 0.11), which is in line with genome-wide genetic correlations (G) for pairs UC and BP (G = 0.23), CD and BP (G = 0.22), UC and SCZ (G = 0.14), and CD and SCZ (G = 0.12) reported by Tylee et al.11. The dendrogram reflects the corresponding hierarchical single linkage clustering across diseases. Genetic trait correlations for single-tissue results (analysis Single-tissueconditional) are given in Supplementary Data 9, 10. For the selection of 23 tissues, see Fig. 1, Supplementary Data 2, and Methods. Results from unconditioned cross-tissue TWAS analysis (GBJmarginal; before multiple-gene-conditioned fine-mapping analysis) are shown in Supplementary Fig. 2.

