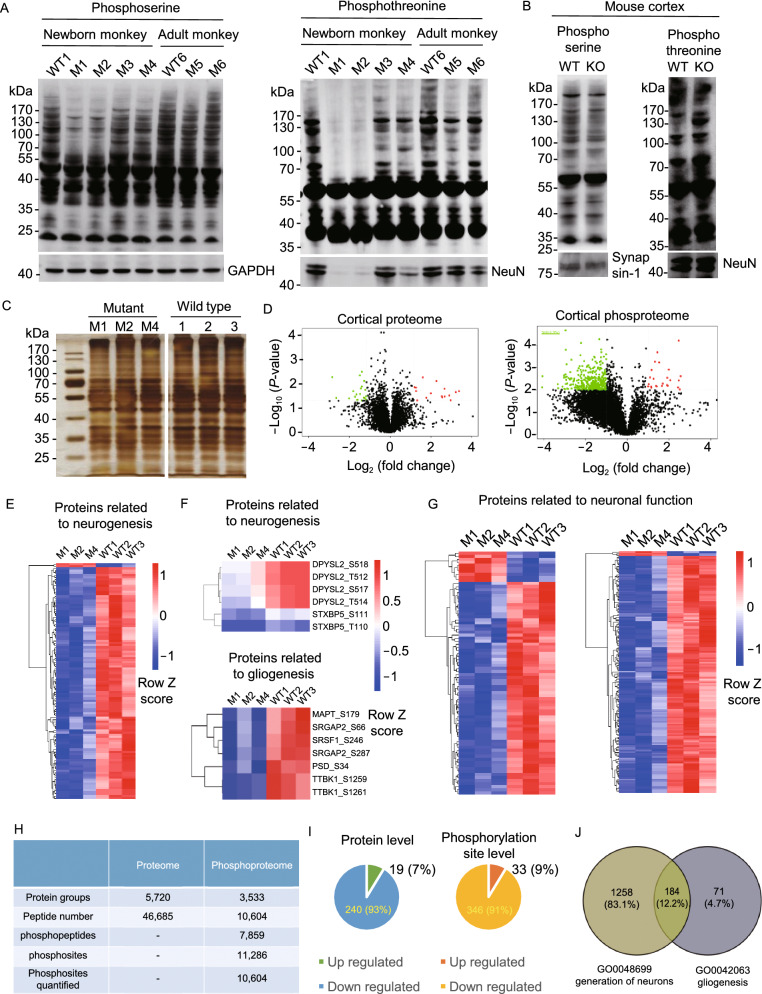
Figure 6.
Broad effects of PINK1 loss on protein phosphorylation. (A) Western blot analysis of cortical lysates of PINK1 mutant newborn (M1, M2, M3, M4) and adult (M5, M6) monkeys and one newborn (WT1) and one 3-year-old (WT6) wild-type monkeys. (B) Western blots of WT and Pink1 knock-out (KO) mouse brain cortical tissues. In (A) and (B), the samples were probed with antibodies to phosphoserine, phosphotheronine, NeuN, synapsin-1, and GAPDH. (C) Silver staining of monkey brain cortical lysates (M1, M2, M4, and 3 WT newborn monkeys, 1, 2, 3) used for mass spectrometry. (D) Volcano plot of the monkey cortical proteome and phosphoproteome showing the upregulated (red spot) and downregulated (green spot) proteins between PINK1 mutant and WT monkeys. X-axis represents the log2 ratio between mutant and WT, and the Y-axis represents log10 (P-value). Phosphopeptides that showed a 1.5-fold or greater change and p-value less than 0.05 were considered significantly up- or down-regulated. (E) Heatmap of the phosphorylation sites from proteins involved in neurogenesis. (F) Examples of protein whose expression is important for neurogenesis or gliogenesis and is also reduced in PINK1 mutant monkey brains. (G) Heatmap of the phosphorylation sites from proteins involved in neuronal function. (H) The numbers of proteins, peptides, phosphopeptides, phophosites identified in monkey cortical tissues. (I) Summary of the up- and down-regulated proteins and phosphorylation sites in the PINK1 mutant monkey cortices. The quantitative results were median-normalized followed by Student’s t-test assuming equal variance. (J) Summary of the down-regulated phosphorylation of proteins for neurogenesis and gliogenesis

