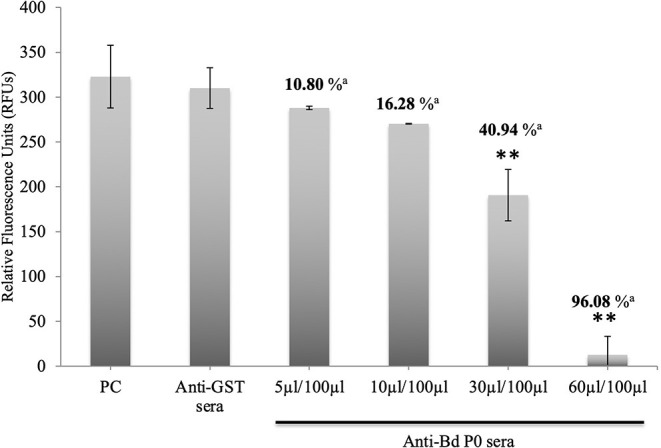
Figure 4.

Growth inhibitory assay of B. divergens with different concentrations of IgGs. Fluorescence values were determined on the fourth day of culture. Statistically significant differences are indicated by asterisks (**p < 0.05) between the control group that received no antibody and groups that received different concentrations of Bd P0 antibodies sera. Results represent two repeated experiments. aInhibition percentage for each concentration.
