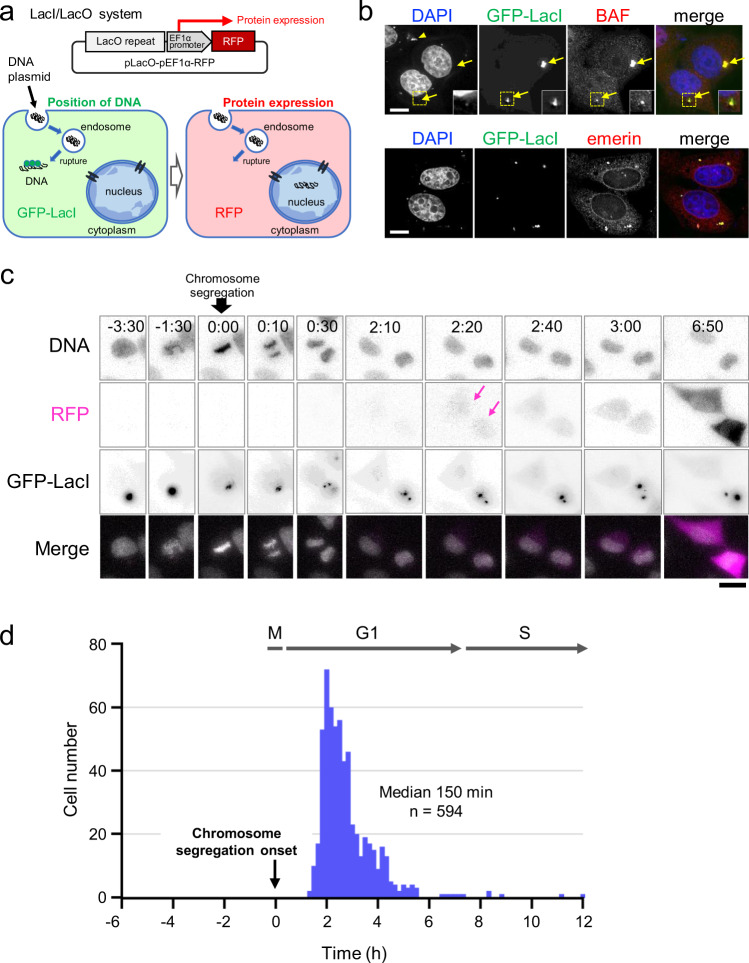
Fig. 1. Gene expression from foreign DNA occurs after mitosis.
a Schematic of the experiment. Top: diagram of pLacO-pEF1α-RFP. This plasmid carries a lacO repeat sequence (256 repeats, approximately 10 kbp) and a sequence expressing a monomeric red fluorescent protein (RFP) under the EF1α promoter. Bottom left: when the transfected plasmid is exposed to the cytosol upon endosome rupture, it binds to GFP-LacI and becomes fluorescent. Bottom right: when it enters the nucleus, the expression of RFP occurs. Therefore, RFP fluorescence is an indication of the nuclear translocation of the plasmid. While using this system, exogenous gene expression was determined by the appearance of RFP fluorescence. b HeLa/GFP-LacI cells transfected with pLacO-pEF1α-RFP (0.5 μg/dish) diagrammed in a. Immediately after transfection, the cells were fixed and stained using anti-BAF or anti-emerin antibodies. DNA (stained with DAPI, blue), GFP-LacI (green), and BAF (red) or emerin (red) in the merged image. Arrows indicate DAPI signals with GFP-LacI signals. Arrowhead indicates DAPI signals without GFP-LacI signals. The inset shows an image with increased brightness in the boxed region. Bar, 10 μm. c Time-lapse live-cell images of transfected HeLa/GFP-LacI cells. DNA was stained with Hoechst 33342 to determine the timing of chromosome segregation. Immediately after transfection, acquisition of time-lapse images at 10-min intervals was started. Selected time frames are shown. Images at each time frame are maximum intensity projection images for z-stacks. The numbers represent time (h:min). Time 0 represents the onset of chromosome segregation. Merged images, DNA (Hoechst 33342, white) and RFP (magenta). Bar, 20 μm. d Timing of protein expression from transfected DNA. The timings of RFP expression and chromosome segregation were determined in individual cells by time-lapse live-cell imaging as described in c. X axis represents the time of RFP expression in hours when the timing of chromosome segregation was set to zero for each cell. Y axis is the number of cells that expressed RFP at that time. Cell numbers plotted were n = 248 by DV and n = 346 by LSM880; total number, n = 594. These data are combined in this graph.

