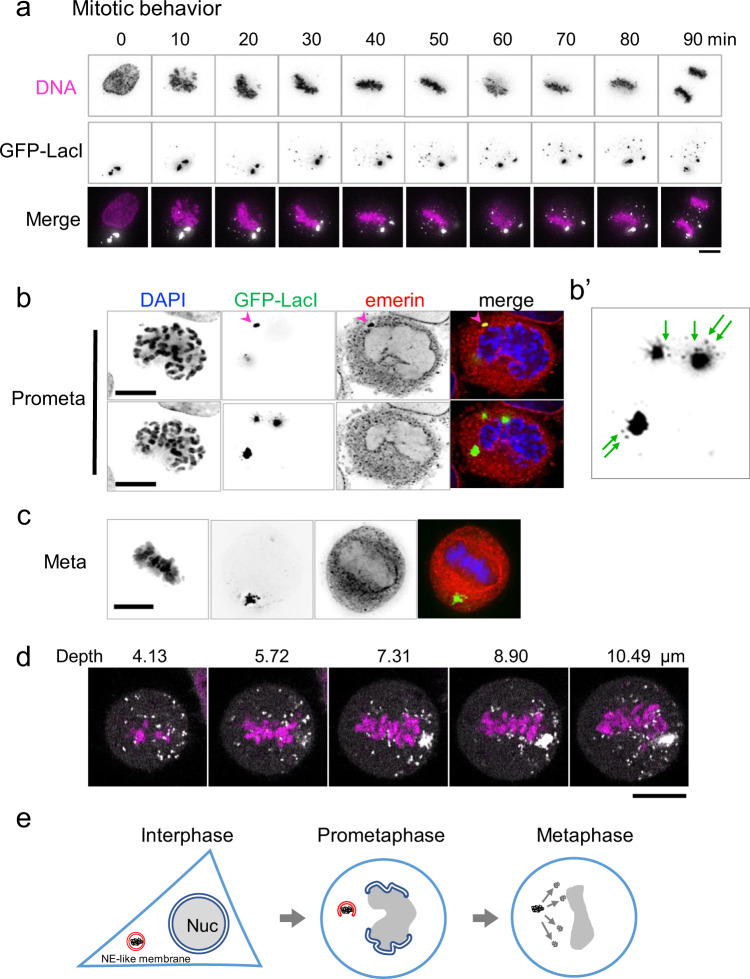
Fig. 2. DNA puncta disperse during mitosis.
a Representative time-lapse images of HeLa/GFP-LacI cells transfected with pLacO-pEF1α-RFP. DNA was stained with Hoechst 33342. Immediately after transfection, acquisition of time-lapse images at 10-min intervals was started. Time 0 represents the leftmost image (680 min after the start of image acquisition). DNA (magenta) and GFP-LacI (white) in the merged images. Bar, 10 μm. b HeLa/GFP-LacI cells transfected with pLacO-pEF1α-RFP, fixed, and stained for emerin as indicated in Fig. 1b. A single, representative prometaphase cell is shown. The upper and lower rows show the same cell at focal planes 1.5 μm apart. Arrowhead indicate puncta with emerin signals. DAPI (DNA, blue), GFP-LacI (green), and emerin (red) are shown in the merged image. Bars, 10 μm. b′ Enlarged image of the lower panel of GFP-LacI in Fig. 2b. Arrows indicate small puncta. c A metaphase cell is shown in the same manner as in b. Bar, 10 μm. d Super-resolution images of GFP-LacI and chromosomes in a metaphase cell. HeLa/GFP-LacI cells were transfected with pLacO-pEF1α-RFP. After transfection, cells were fixed with a fixative as described in Methods. Super-resolution images were obtained using LSM880 Airyscan microscopy. White and magenta represent small puncta of transfected DNA (GFP-LacI) and chromosomes (DAPI), respectively. Bar, 10 μm. e Diagrams of transfected DNA in interphase, prometaphase, and metaphase cells.

