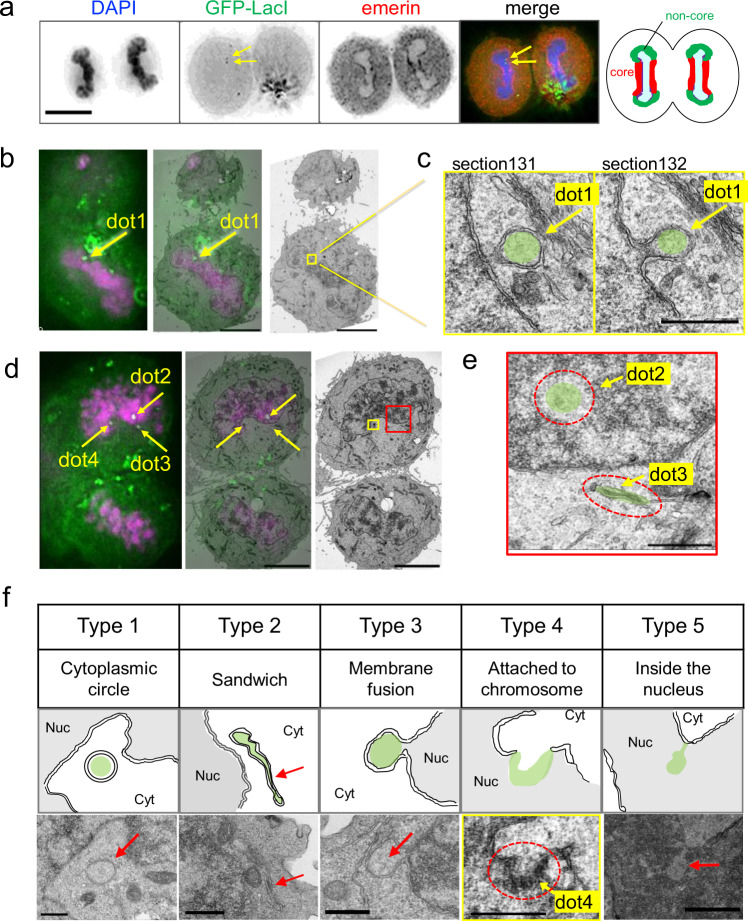
Fig. 3. CLEM images showing small puncta of transfected DNA in telophase cells.
HeLa/GFP-LacI cells were transfected with pLacO-pEF1α-RFP, and then fixed and subjected to indirect immunofluorescence imaging (a) or CLEM (b–f). a Indirect immunofluorescence images of telophase cells. After the removal of the transfection reagent, the cells were fixed and immunostained for emerin. DAPI (DNA, blue), GFP-LacI (green), and emerin (red) are shown in the merged image. The rightmost cartoon illustrates the “core” (red) and “non-core” (green) regions of the NE, forming around the telophase chromosome mass. Bars, 10 μm. b Representative CLEM images of telophase cells. Left, fluorescence microscopic image; middle, merged image; right, electron microscopic image. Colors represent GFP-LacI (green) and DAPI (magenta). Arrows indicate the position of GFP-LacI (dot 1). Bar, 5 μm. c Higher magnification of the yellow-boxed region in b. Arrows indicate the positions of GFP-LacI (dot 1, shaded in green). Section131 and section132 are the neighboring sections, 80 nm apart. Bar, 500 nm. d Different focal planes of the cell shown in b. Left, fluorescence microscopic image; middle, merged image; right, electron microscopic image. Colors represent GFP-LacI (green) and DAPI (magenta). Arrows, positions of GFP-LacI (dots 2–4). Bar, 5 μm. e Higher magnification of the red-boxed region in d. Red circles represent the regions of the fluorescence signals, shaded in green. Bar, 500 nm. f Classification of puncta morphologies. Type 1 (cytoplasmic circle): plasmid contained within a circular (or spherical) structure surrounded by an NE-like membrane that is present in the cytoplasm. Type 2 (sandwich): plasmid is present between NE-like membranes. Type 3 (membrane fusion): plasmid contained in the cytoplasmic circle fused with the NE. Type 4 (attached to chromosome): plasmid attached to the telophase chromosomes. Dot 4 is the same dot 4 shown in d. Type 5 (inside the nucleus): plasmid inside the nucleus. Middle panels, schematics of the electron microscopic images. NE is shown as a double line. Red arrows indicate the positions of GFP-LacI, shaded in green. Electron microscopic images of wider areas, including the area shown in this figure, are shown in Supplementary Fig. 3. Bars, 500 nm for Types 1-4 and 1 μm for Type 5.

