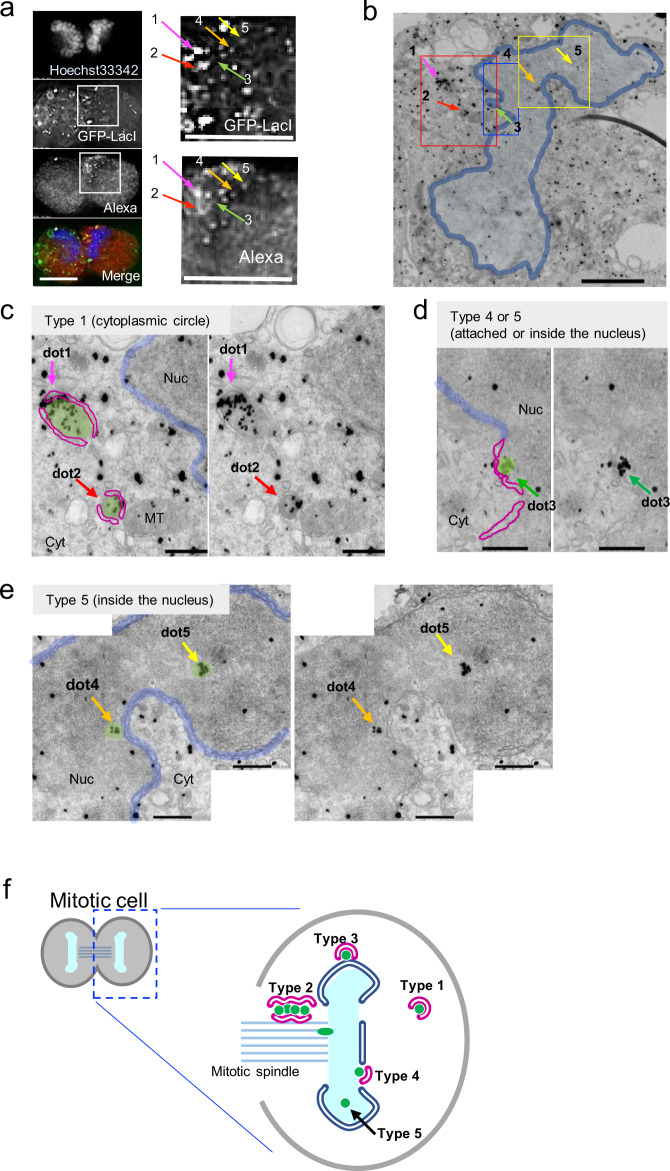
Fig. 4. Immuno-CLEM (iCLEM) images of telophase cells.
HeLa/GFP-LacI cells were transfected with pLacO-pEF1α-RFP, and then fixed and subjected to iCLEM. a Fluorescence microscopic images. Left: Overview fluorescence images. DNA (stained with Hoechst 33342, blue), GFP-LacI (green), and Alexa-nanogold (red) in the merged image. Right: Enlarged images of the white-boxed region in the left panel. Numbers 1–5 correspond to the dots analyzed in b–e. Bars, 10 μm. b Low-magnification electron micrograph of the telophase cell shown in a. Blue contour, the edge of telophase chromosome mass. Arrows indicate the positions analyzed. Red-, blue-, and yellow-boxed regions are enlarged in c–e, respectively. Bar, 2 μm. c Representative type 1, from the red-boxed region in b. Red contour, NE-like structures. Blue contour, edge of the nucleus. Arrows indicate the positions of dots 1 and 2. Nuc, Cyt, and MT label the nucleus, cytoplasm, and mitochondria, respectively. Bars, 500 nm. d Representative type 4 or 5, from the blue-boxed region in b. Red contour, NE-like structures. Blue contour, edge of the nucleus. Arrows indicate the positions of dot 3. Nuc and Cyt label the nucleus and cytoplasm, respectively. Bars, 500 nm. e Representative type 5, from the yellow-boxed region in b. Blue contour, edge of the nucleus. Arrows indicate the positions of dots 4 and 5. Nuc and Cyt label the nucleus and cytoplasm, respectively. Bars, 500 nm. f Diagrams of typical localizations of transfected DNA in telophase cells.

