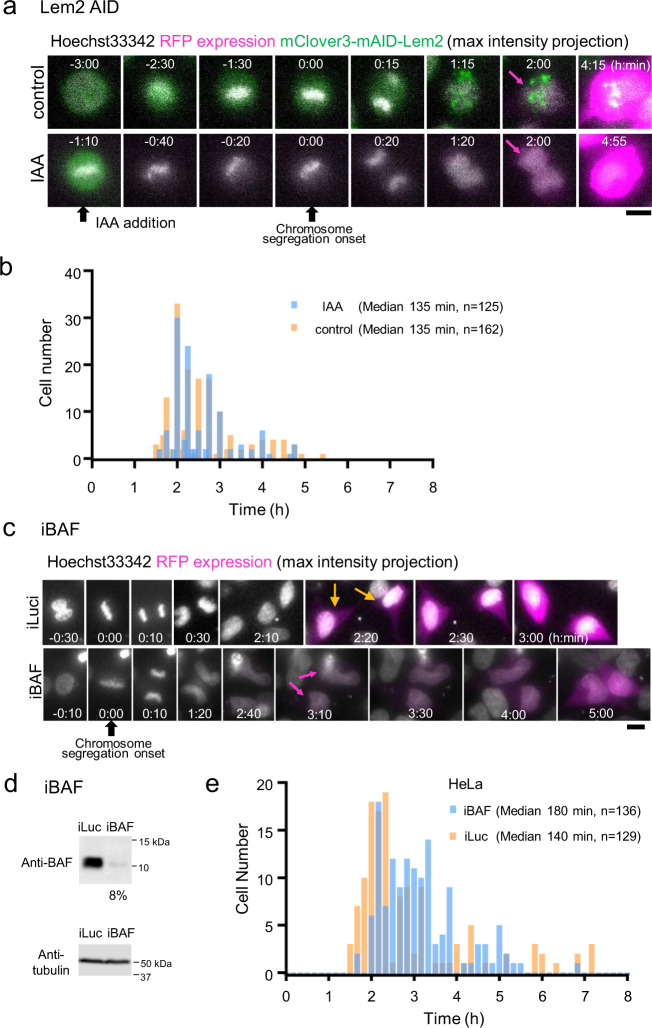
Fig. 5. Depletion of BAF delays protein expression from exogenous DNA.
a Time-lapse images of HeLa/mClover3-mAID-Lem2 cells. HeLa/mClover3-mAID-Lem2 were transfected with pEF1α-RFP plasmid. DNA was stained with Hoechst 33342 to determine the timing of chromosome segregation. Immediately after transfection, time-lapse live-cell images were acquired every 10 or 15 min (2 μm × 5 z-stacks for each time point). IAA (indole-3-acetic acid) or ethanol as a control was added to the cells during live-cell imaging. Maximum intensity projection images of selected time points are shown. Colors represent mClover-mAID-Lem2 (green), RFP (magenta) and Hoechst 33342 (white). The numbers represent time (h:min). Black arrows, timings of the addition of IAA and the onset of chromosome segregation as indicated. Magenta arrows, timing of RFP expression. Bar, 10 μm. b Timing of RFP expression in Lem2-depleted HeLa (IAA) and control parental (control) cells. The timing of RFP expression in individual cells was determined by time-lapse imaging of each cell as shown in a. X axis represents the time of RFP expression in hours when the timing of chromosome segregation was set to zero for each cell. Y axis is the number of cells that expressed RFP at that time. Cell numbers plotted and the median values of RFP expression are shown in the graph. c Time-lapse images of transfected HeLa cells treated with siRNA targeting BAFN1 (iBAF) and control siRNA (iLuc). Cells were treated with siRNA (iBAF or iLuc) and transfected with pEF1α-RFP plasmid. DNA was stained with Hoechst 33342 to determine the timing of chromosome segregation. Immediately after transfection, time-lapse live-cell images were acquired at 10-min intervals (2 μm × 5 z-stacks for each time point). Images projected by the maximum intensity projection for z-stacks are shown. Colors represent RFP expression (magenta) and Hoechst 33342 (white). The numbers represent time (h:min). Time 0 represents the onset of chromosome segregation (black arrow). Orange and magenta arrows, timing of RFP expression. Bar, 10 μm. d Western blotting of lysates of HeLa cells treated with siRNA targeting BAFN1 (iBAF) and control siRNA (iLuc). Tubulin was used as a loading control. e Timing of RFP expression in HeLa cells treated with iBAF and iLuc. The timing was determined by time-lapse live-cell imaging of individual cells as shown in c. X axis represents the time of RFP expression in hours when the timing of chromosome segregation was set to zero for each cell. Y axis is the number of cells that expressed RFP at that time. Cell numbers are plotted and the median values of RFP expression are shown in the graph.

