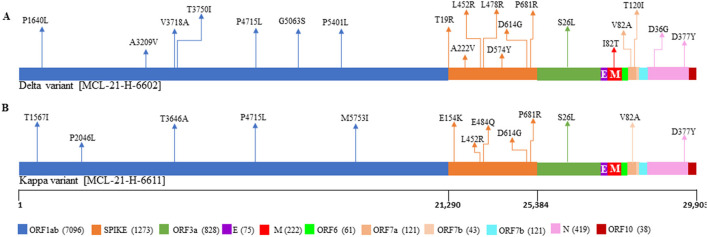
Figure 5.
Representation of mutations within SARS-CoV-2 genome for the patients with the vaccine breakthrough infections. The plot displays the different locations of the mutations observed in each sample, with different colors corresponding to different genes. (A) Represents the mutations from the patient breakthrough sequence Delta variant. (B) Represents the mutations from the breakthrough sequence Kappa variant.

