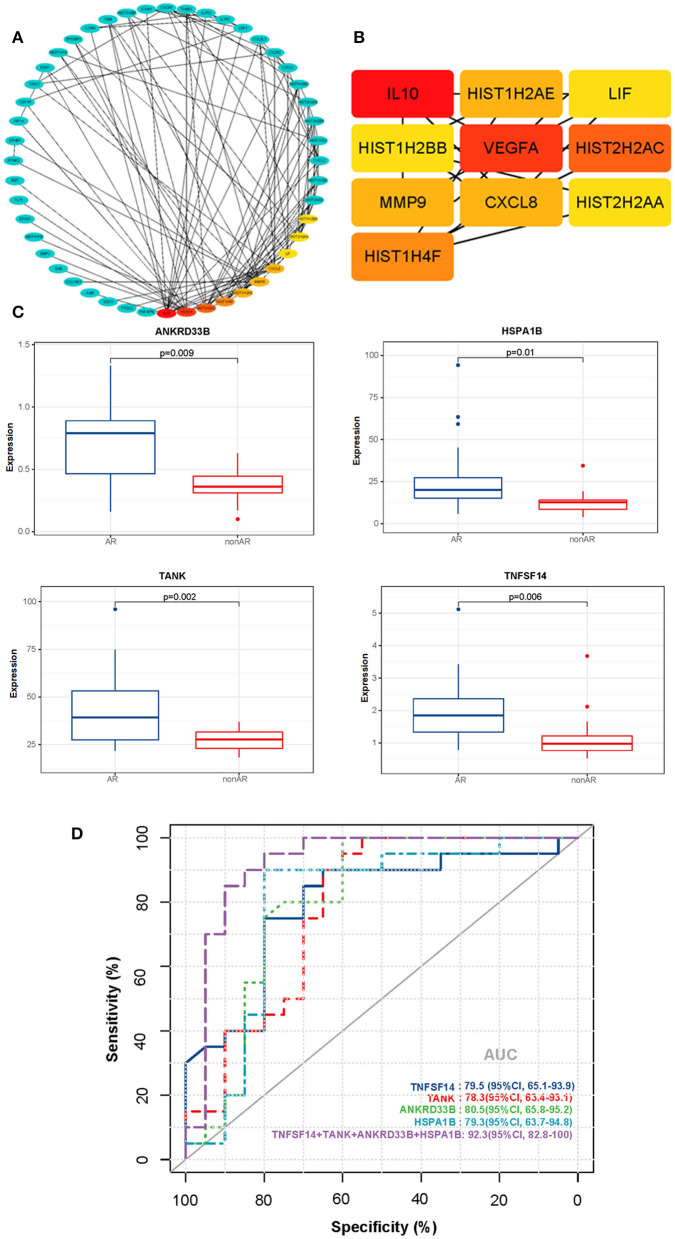
Figure 7.
PPI networks of DEGs and ROC curves for diagnosis of AR. (A) The PPI network of DEGs detected in AR vs. non-AR groups was performed with Cytoscape. (B) The hub genes were identified by the CytoHubba plugin with the top 10-degree score. (C) Box plots of the mRNA expression. (D) ROC curves were constructed to determine the diagnostic power of DEGs for AR. TNFSF14: AUC 79.5 (95% CI, 65.1–93.9); TANK: AUC 78.3 (95% CI, 63.4–93.1); ANKRD33B: AUC 80.5 (95% CI, 65.8–95.2); HSPA1B: AUC 79.3 (95% CI, 63.7–94.8); NFSF14+TANK+ANKRD33B+HSPA1B: AUC 92.3 (95% CI, 82.8–100).

