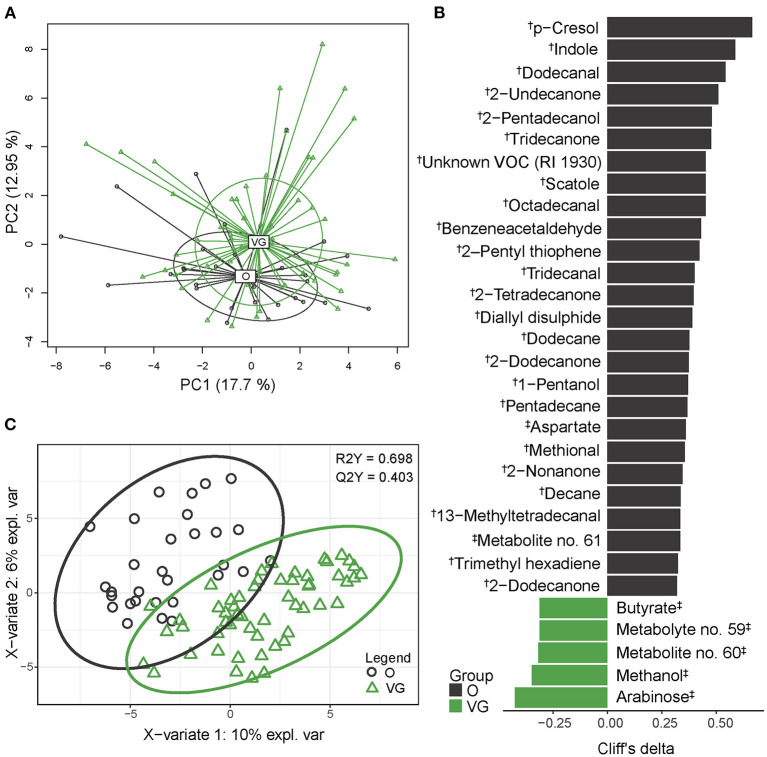
Figure 2.
Fecal metabolome composition. (A) 2D PCA analysis score plot with the explained variance of each component. (B) Biomarker metabolites generated from univariable discrimination analysis (FDR ≥0.1), effect size estimated by Cliff's delta. (C) 2D score plots of PLS-DA. R2Y fit goodness, Q2Y predictive power. †metabolites identified by GC-MS; ‡metabolites identified by NMR. Effect sizes, FDR values and VIP values can be found in Supplementary Table 4. Volatile compound (VOC) abundances are presented as compositional after clr transformation, NMR data were normalized by probabilistic quotient normalization (PQN).

