Figure 4.
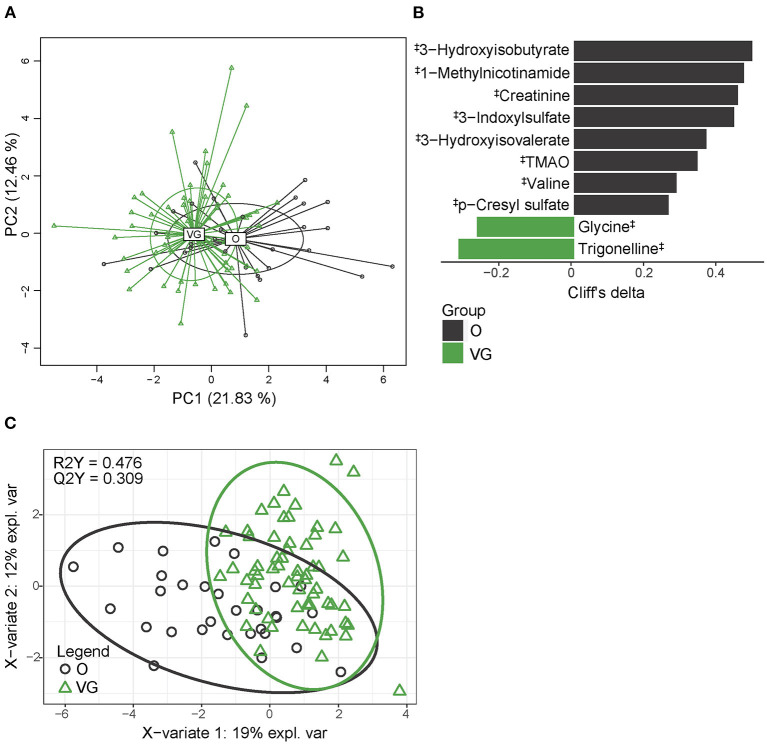
Urine metabolome composition. (A) 2D PCA analysis score plot with the explained variance of each component; (B) Biomarker metabolites generated from univariable discrimination analysis (FDR ≥ 0.1), effect size estimated by Cliff's delta. (C) 2D score plots of PLS-DA. R2Y fit goodness, Q2Y predictive power. ‡metabolites identified by NMR. Effect sizes, FDR values, and VIP values can be found in Supplementary Table 7. NMR data were normalized by PQN.

