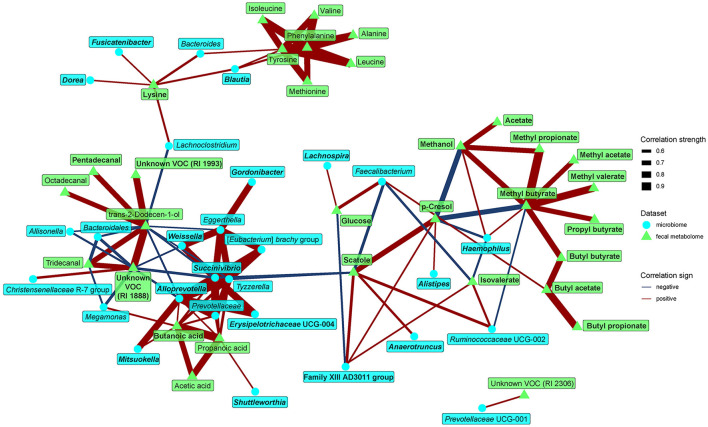
Figure 5.
Spearman's correlations between bacteria and fecal metabolome components. The compositional data (values of bacteria and VOC abundance) were clr transformed prior to the construction of the networks, whereas data obtained from NMR were normalized by PQN. The edge width and color are proportional to the value of the correlation (red: positive; blue: negative). The features highlighted in bold were selected as significantly contributing to the discrimination between groups.

